Introduction
Jamie Brandon of scattered-thoughts.net recently put out a blog post called “Looking for Debugger”. In it, he goes through all of the debuggers and debugger frontends on Linux that he knew of and details their deficiencies from his perspective and asks for help finding a good set of tools.
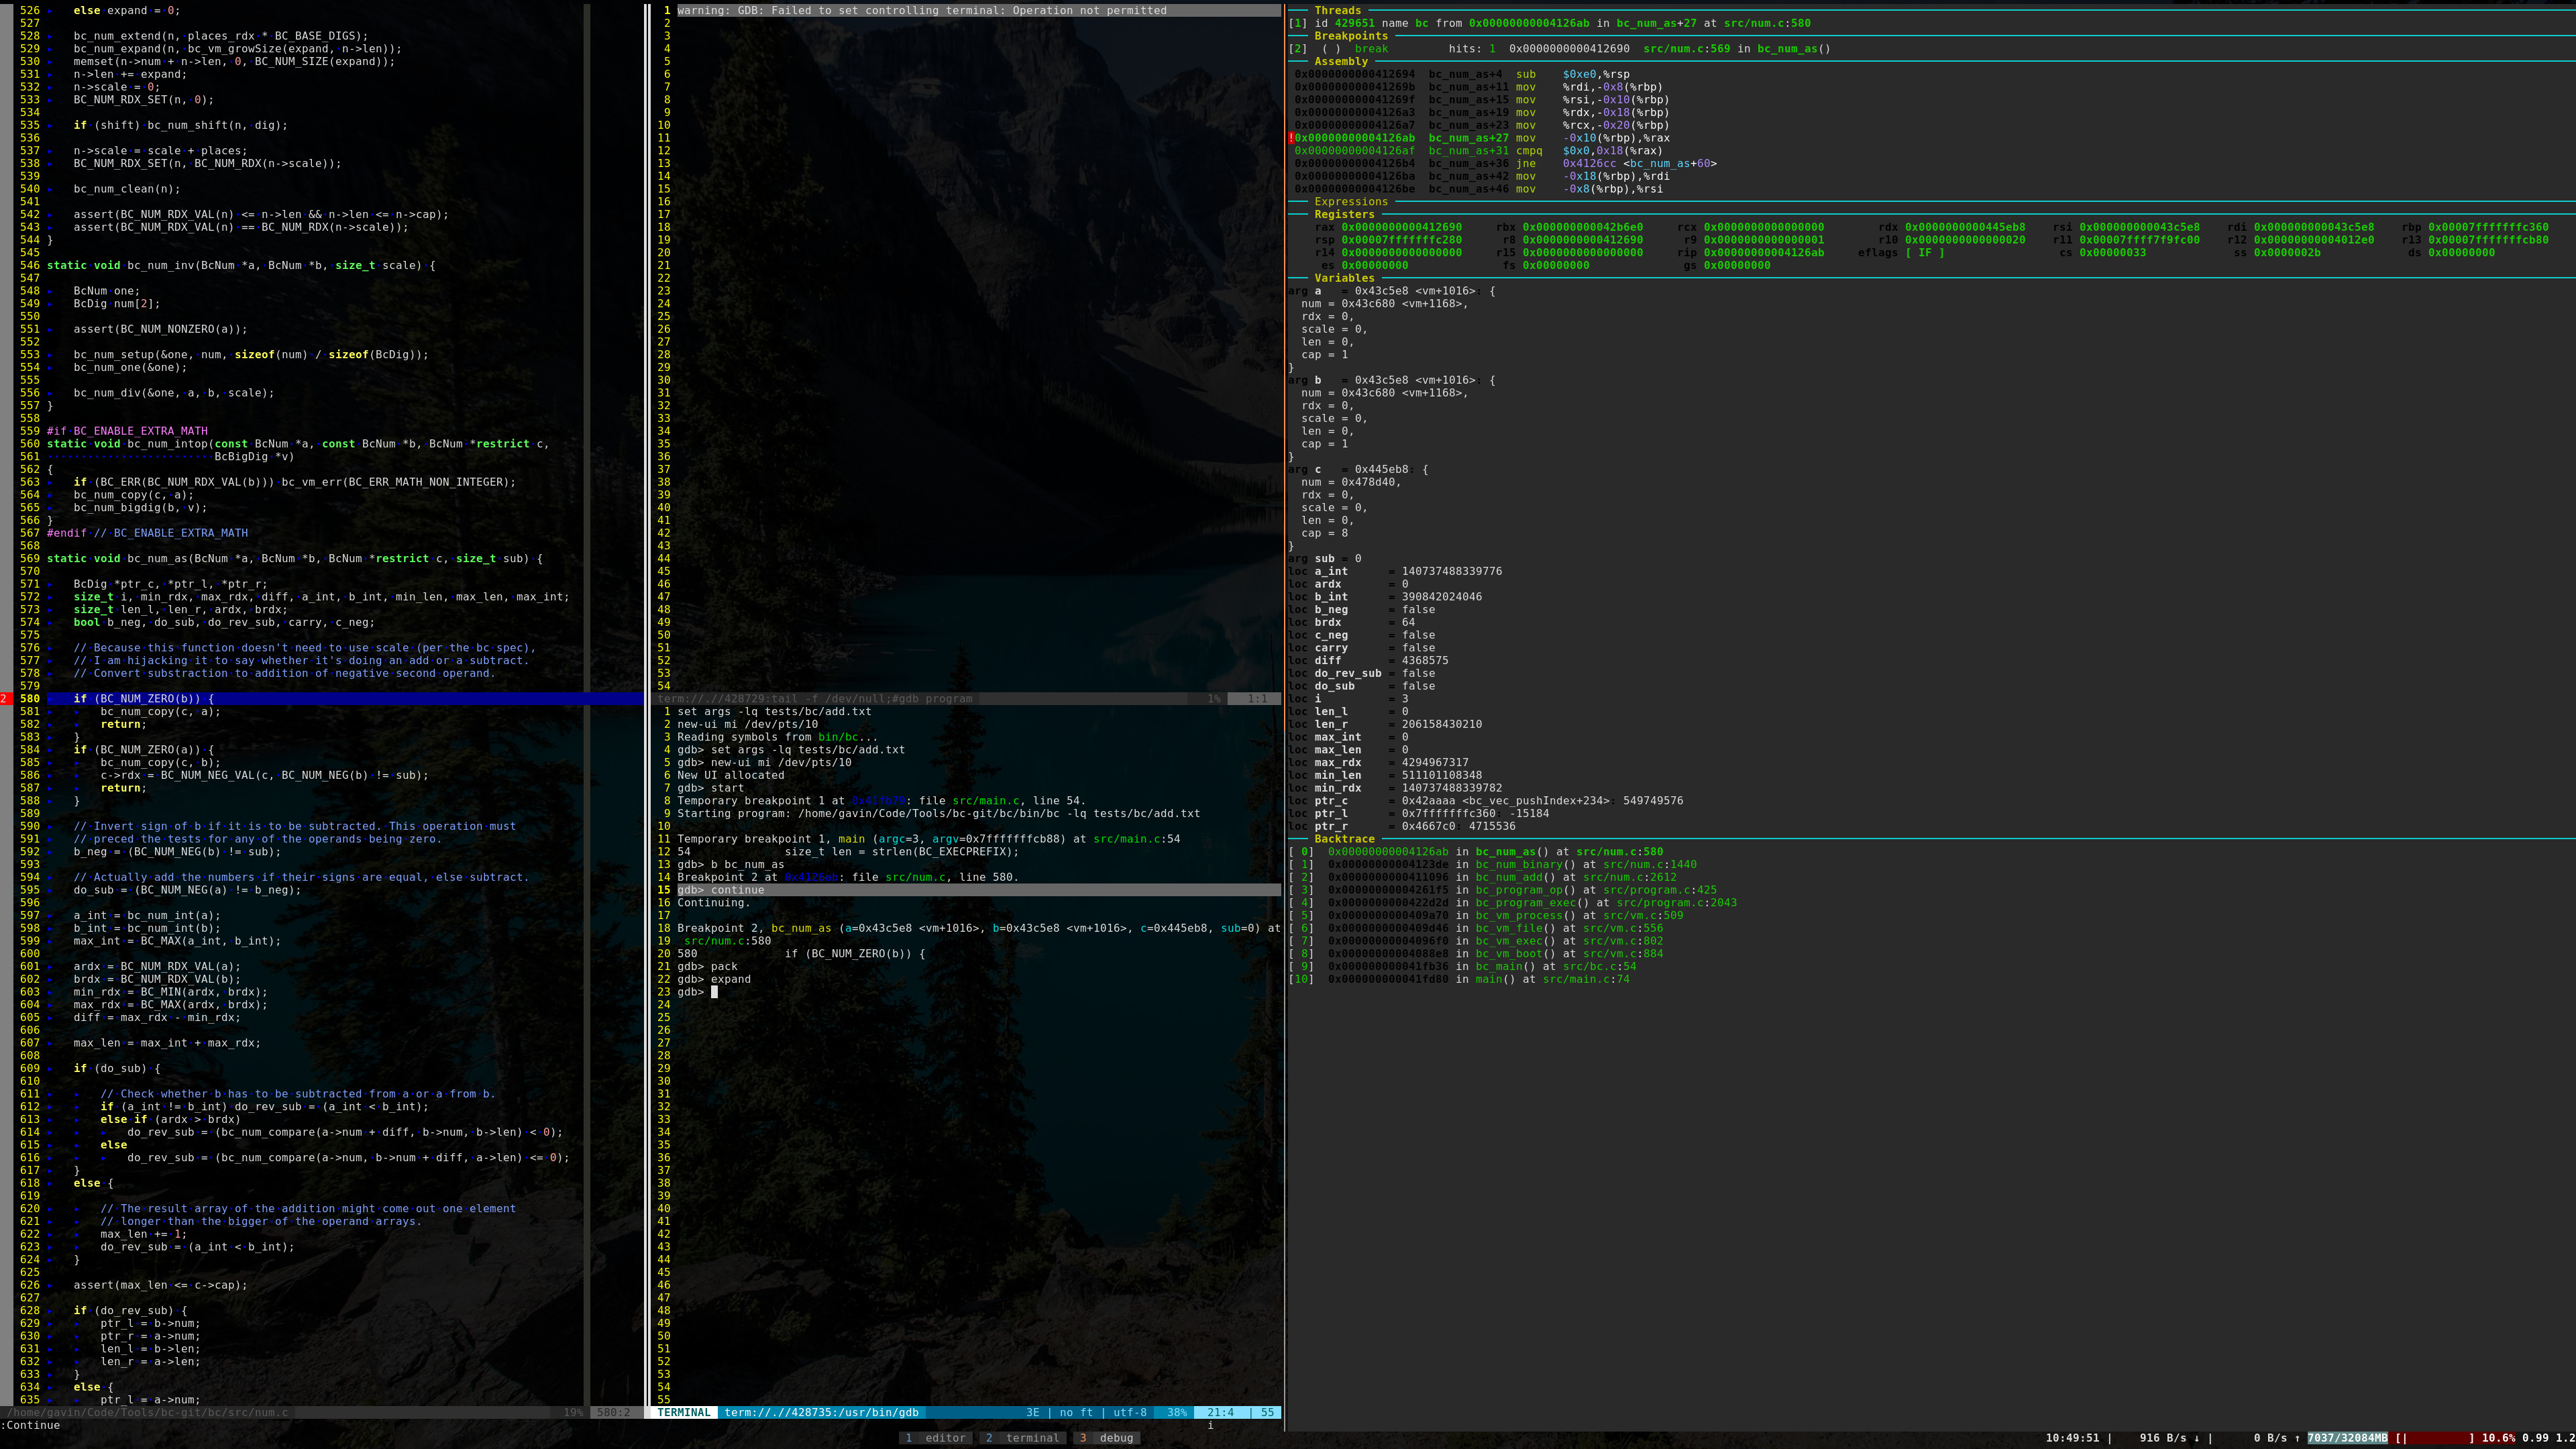
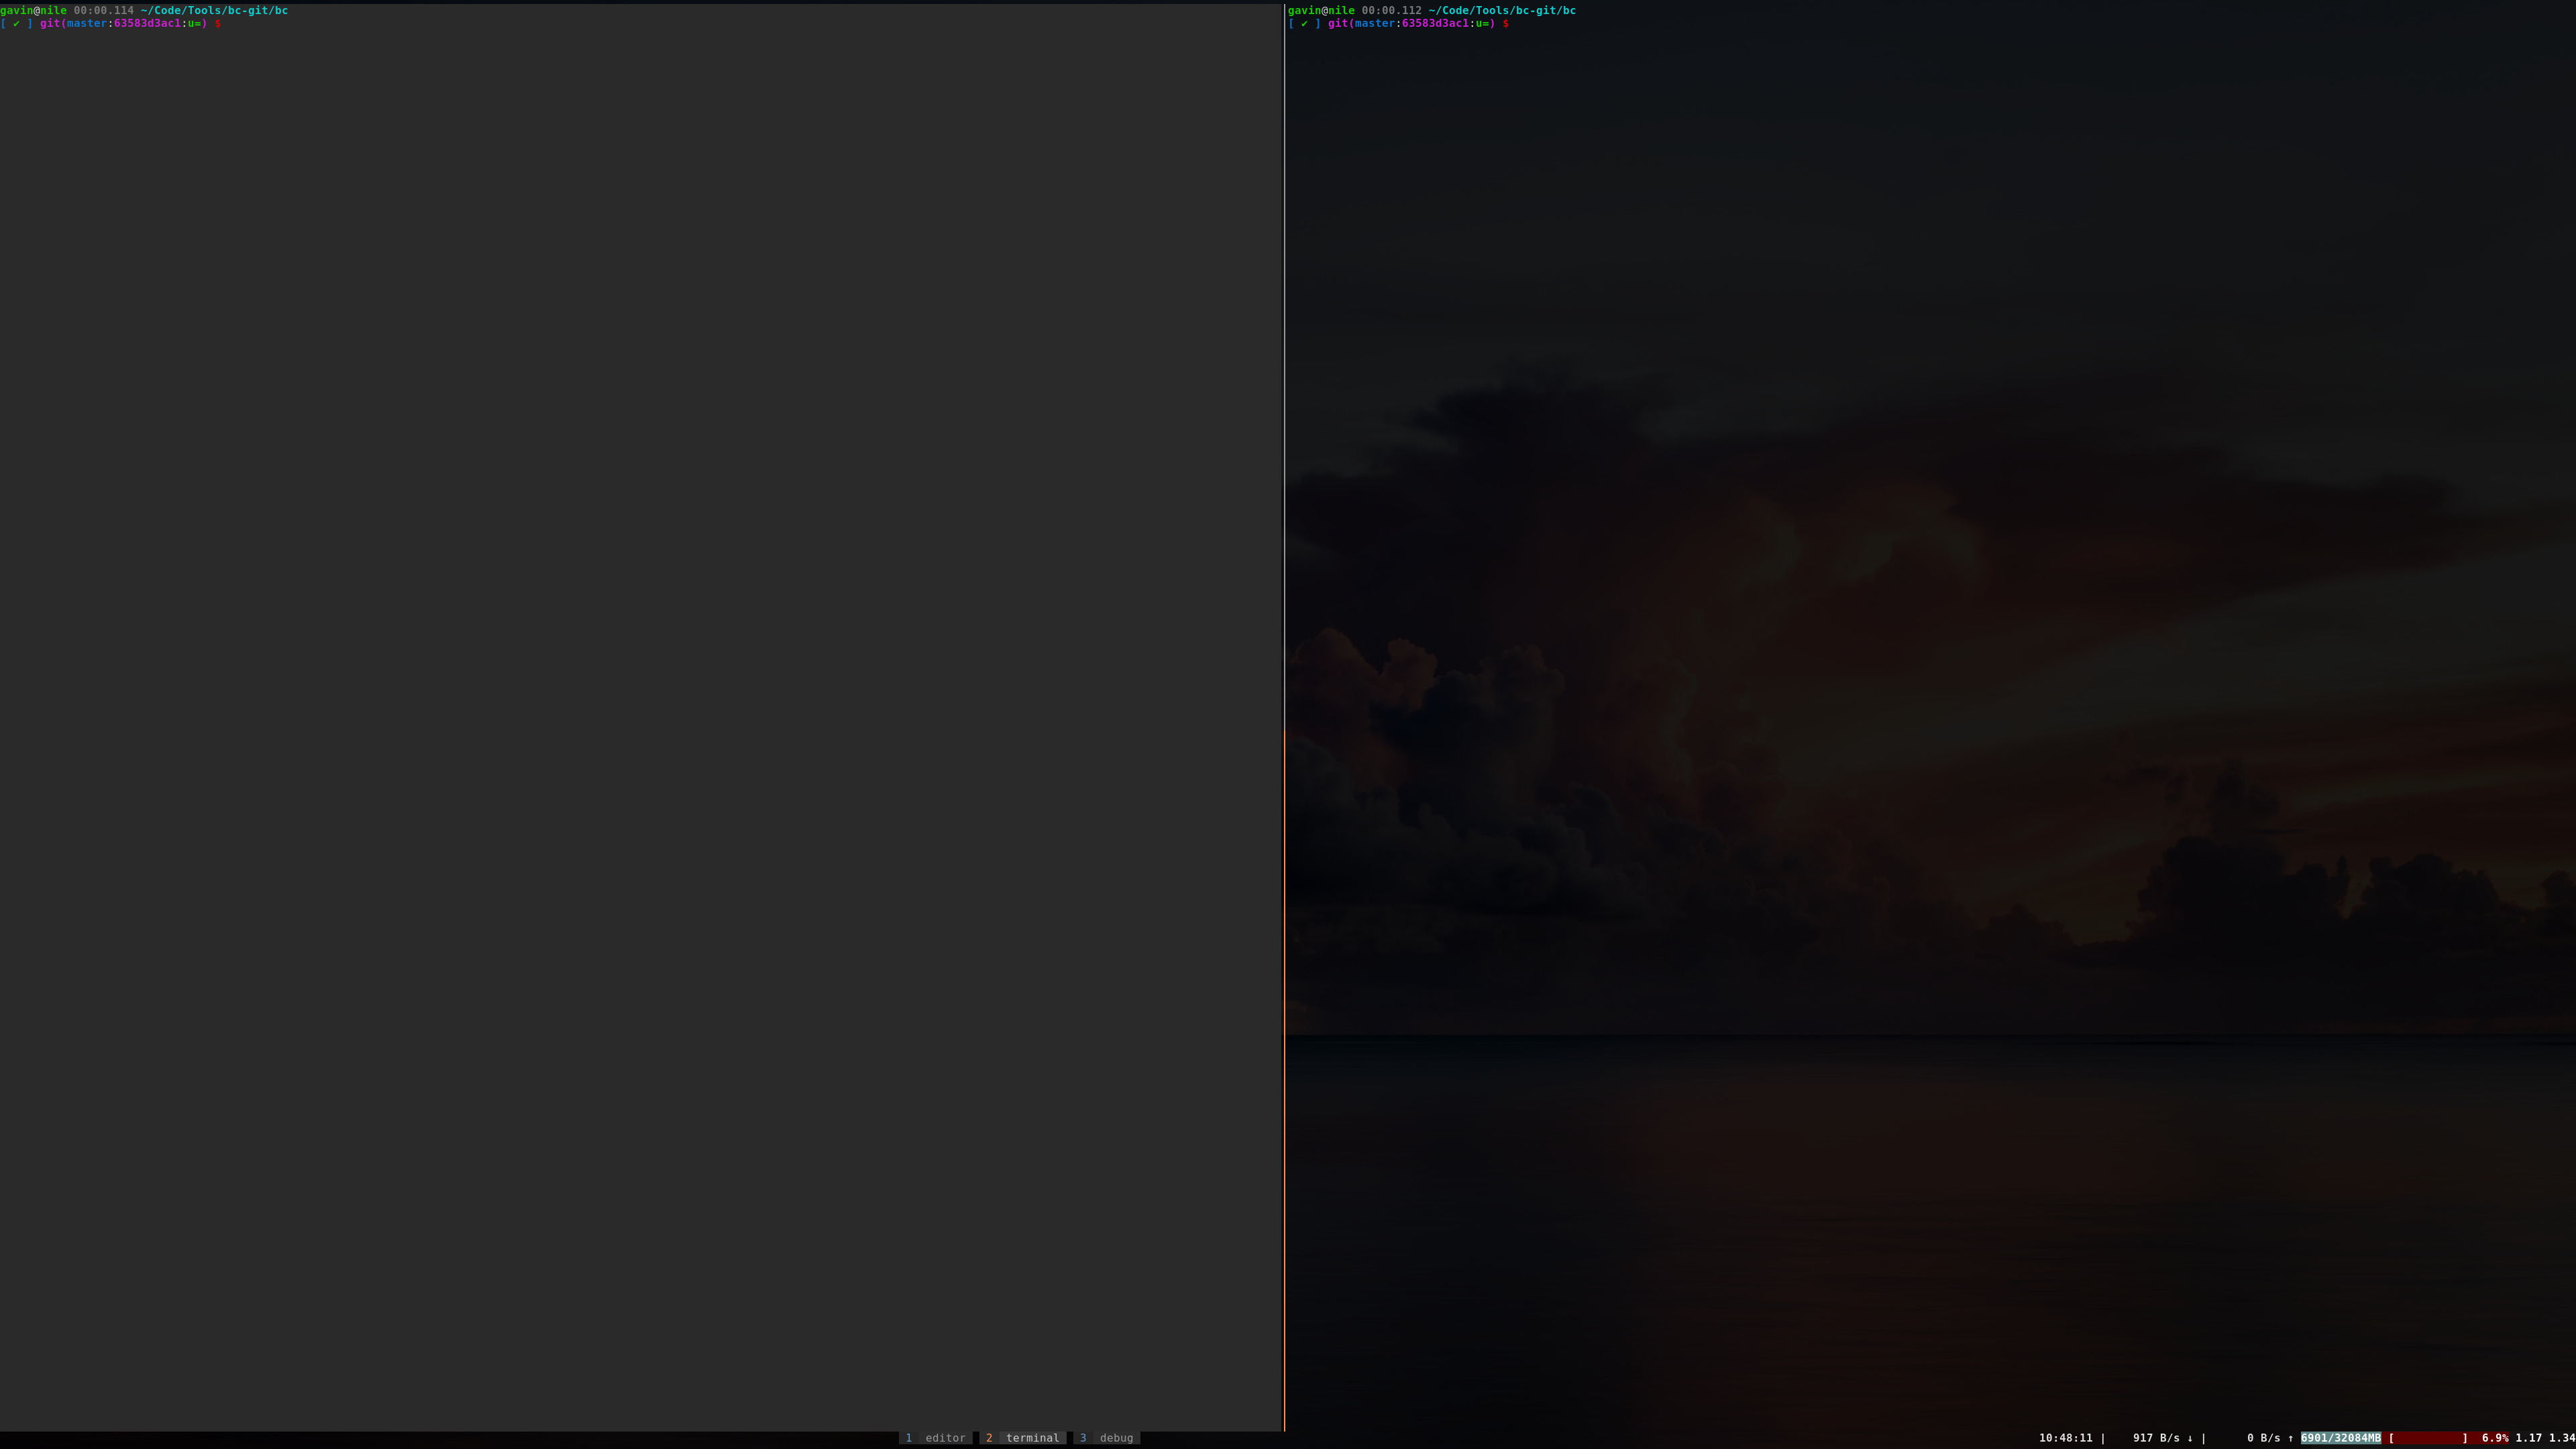
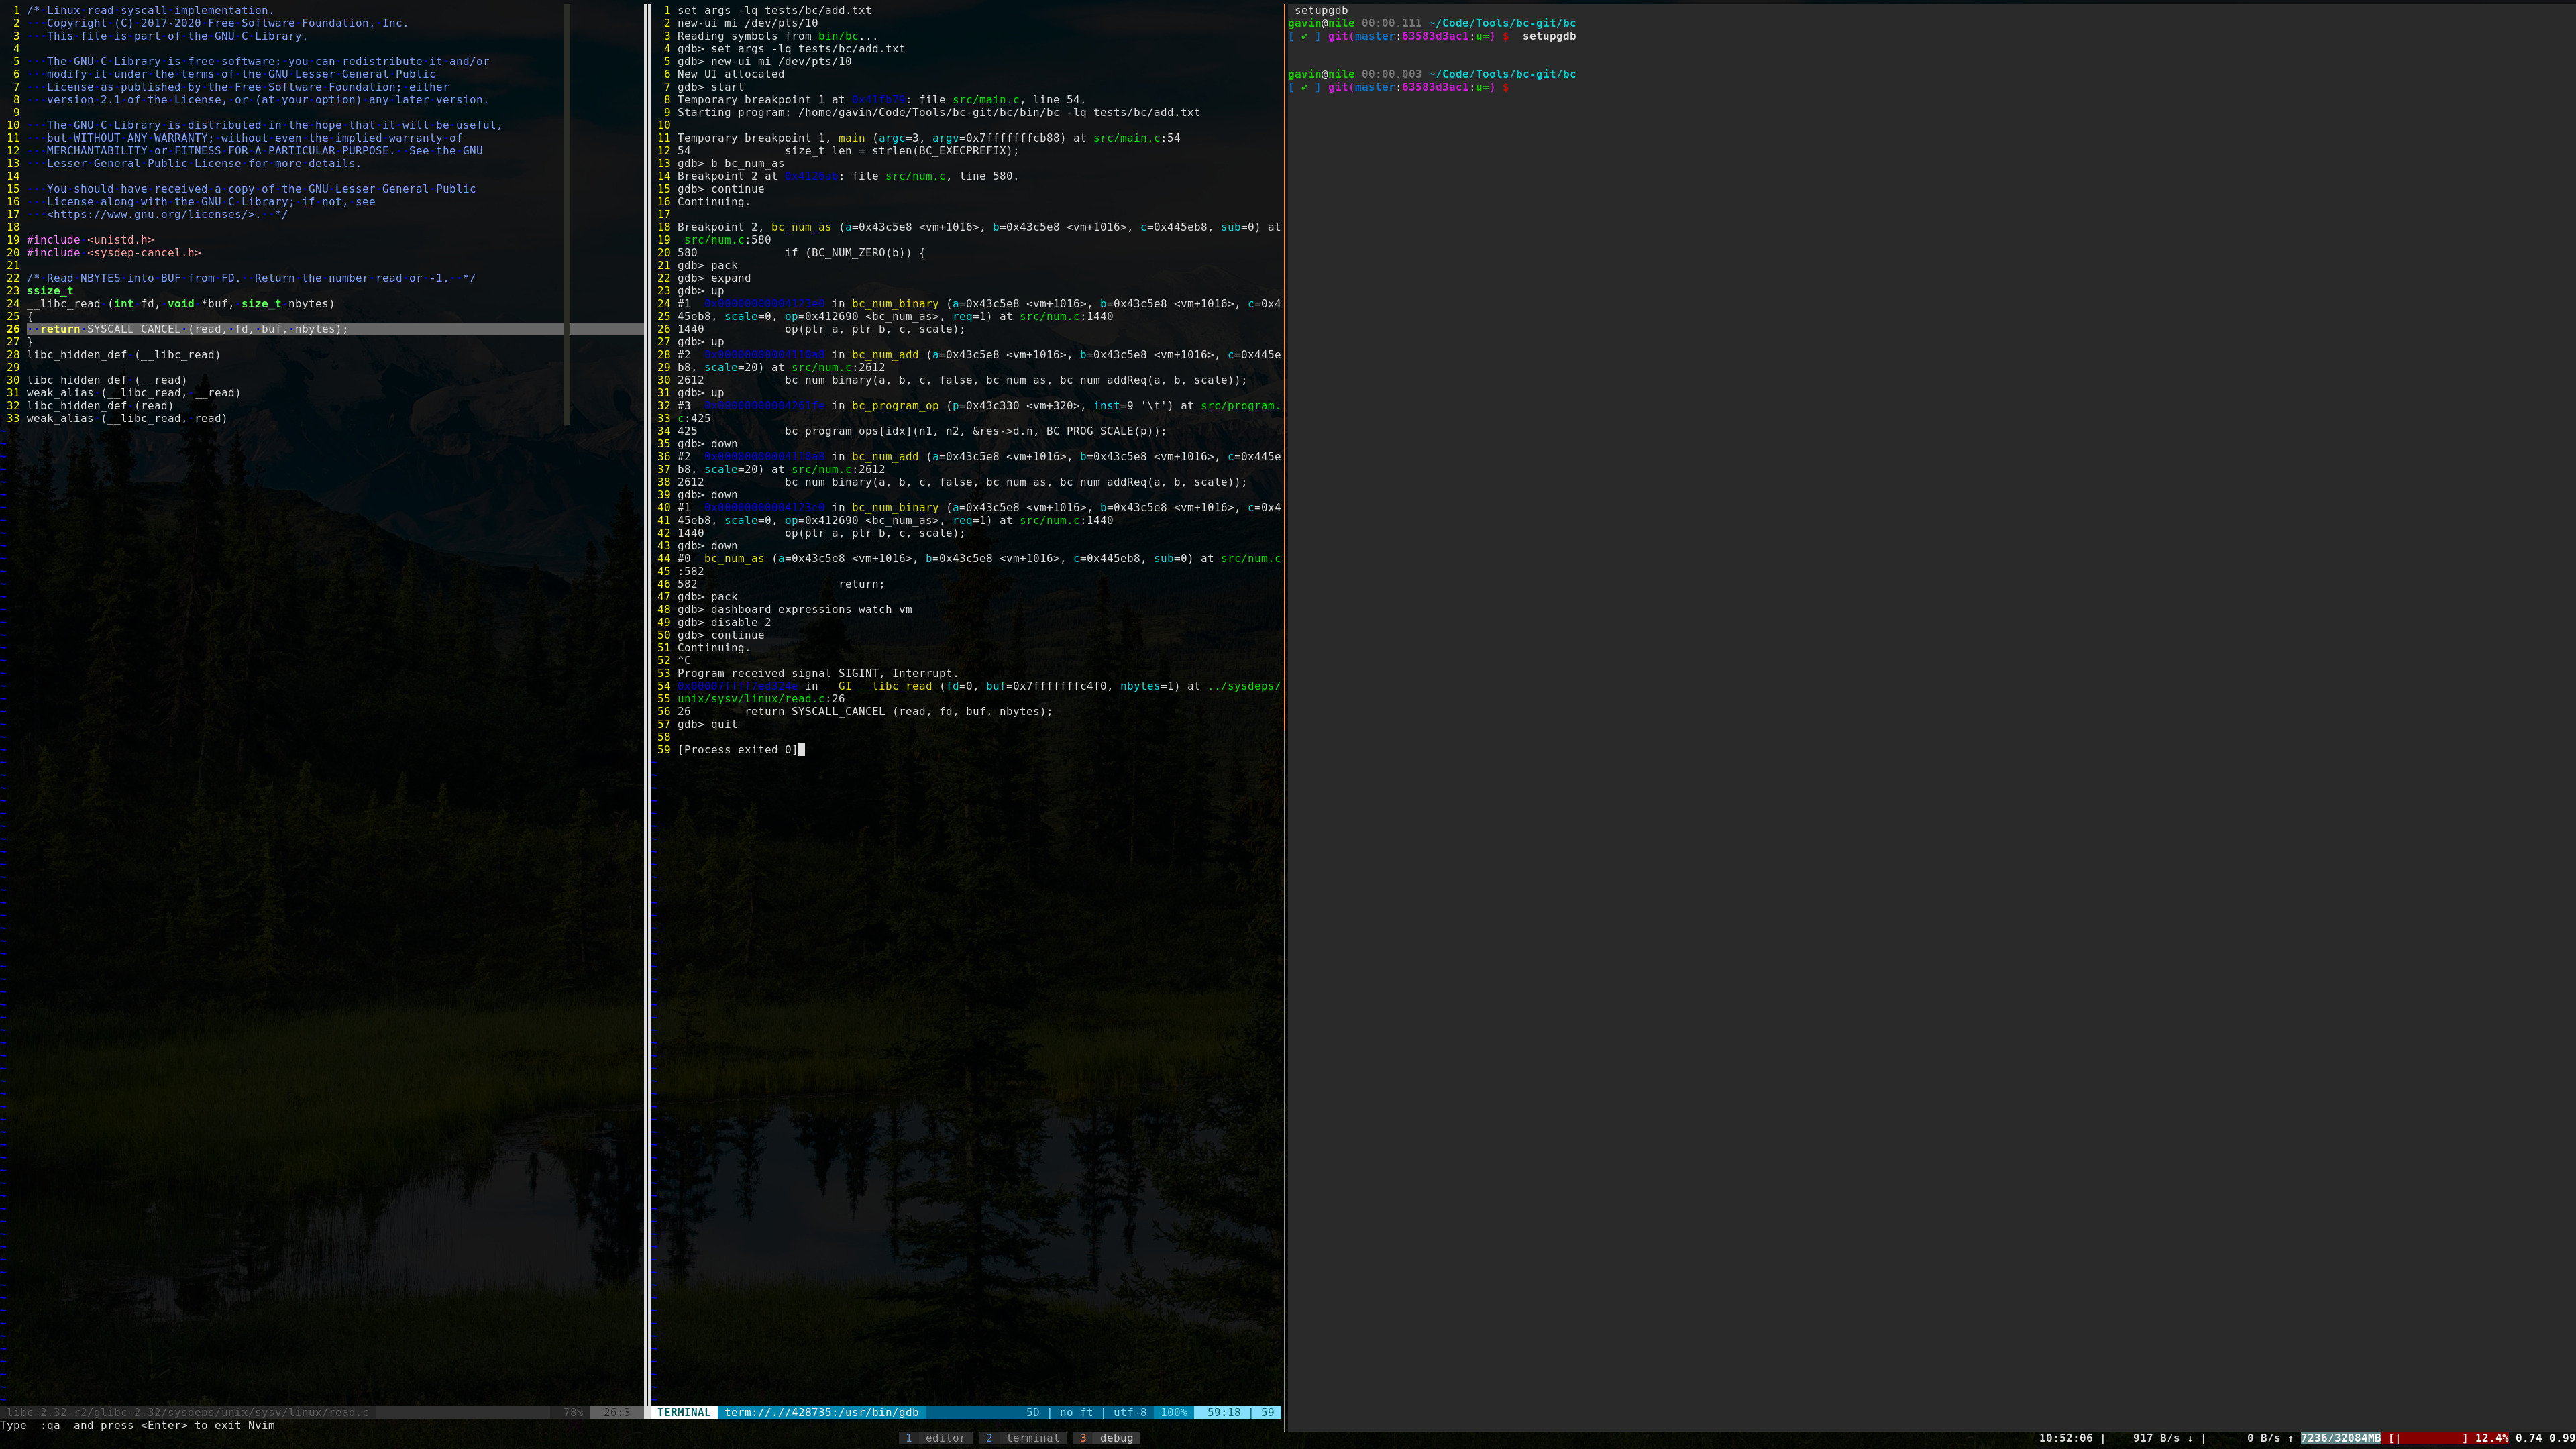
This is my answer, and here’s a sneak peek (click for full size):
For those wondering, yes, I have a 4K screen. And it’s 43 inches.
Tools
First of all, while I am going to attempt to not have the same touch of arrogance as others who say, “Linux is my IDE,” Linux and the tools available on it are, in fact, my IDE.
Here are the tools that matter for debugging:
Neovim
Neovim is my editor of choice. Neovim is just a better vim (in my opinion);
vim itself should work.
In fact, vim had a feature I wanted before Neovim did: opening a terminal
window vertically. However, the Neovim folks were kind enough to accept a PR
from me.
The important part about Neovim (and vim) is that they have support for
debugging inside of the editor itself. They call it termdebug. It is this that
allows me to have an IDE-like experience without the IDE.
Thus, Neovim is the keystone of my debugging setup.
The relevant parts of my 764 line(!) Neovim config are:
packadd termdebug
let g:termdebug_wide = 1

tnoremap <Esc> <C-\><C-n>

nnoremap <RightMouse> :Evaluate<CR>

command GdbStart :call TermDebugSendCommand('start')
command GdbUp :call TermDebugSendCommand('up')
command GdbDown :call TermDebugSendCommand('down')
command GdbSaveBreakpoints :call TermDebugSendCommand('sb')
command GdbLoadBreakpoints :call TermDebugSendCommand('lb')
command GdbQuit :call TermDebugSendCommand('quit')

nnoremap <F1> :Gdb<CR>
nnoremap <F2> :Program<CR>
nnoremap <F3> :Continue<CR>
nnoremap <F4> :Over<CR>
nnoremap <F5> :Step<CR>
nnoremap <F6> :Finish<CR>
nnoremap <F7> :GdbUp<CR>
nnoremap <F8> :GdbDown<CR>
nnoremap <F9> :GdbLoadBreakpoints<CR>
nnoremap <F10> :GdbSaveBreakpoints<CR>
nnoremap <F11> :Break<CR>
nnoremap <F12> :Clear<CR>

nnoremap <Leader>. :Termd<Up><CR>
nnoremap <C-e> :GdbStart<CR>
nnoremap <Leader>q :GdbQuit<CR>
nnoremap <Leader>' :Source<CR>
The first two lines tell Neovim to enable terminal debugging and to open the
terminal vertically. Line 4 lets me use the <Esc> key to exit insert mode in
the terminal, and line 6 lets me use the right mouse button to evaluate an item.
(I don’t use that feature often.)
The rest of the commands set up commands keys for easy debugging.
All of my bindings are heavily dependent on my keyboard (a keyboard.io
Model 01), so you will probably want to heavily modify them.
The way it is set up for me, I just have to run :TermdebugCommand <command>
once, and then when I want to debug the same command again, I just have to press
<Leader>.. (My <Leader> is <Space>.) Then I press <C-e> to start
debugging. My particular setup (Dvorak) means that whole sequence is
<Space>+e, <Ctrl>+e since the period on Dvorak is where e is on Qwerty.
The :Source command tells Neovim to focus on the source pane (the far left of
the sneak peek picture). The :Gdb command tells Neovim to focus on the gdb
window (bottom left center in the sneak peek), and the :Program command tells
it to focus on the program output window (top left center in the sneak peek).
More on all of that later.
The :GdbLoadBreakpoints and :GdbSaveBreakpoints commands are my own; more on
them later.
The rest of the commands should be obvious to anyone who knows how to run gdb
on the command-line.
As an extra feature, I have the following in my Neovim config:
nnoremap <Leader>sa :mksession! .session.vim<CR>
vnoremap <Leader>sa <Esc>:mksession! .session.vim<CR>v
nnoremap <Leader>so :source .session.vim<CR>
vnoremap <Leader>so <Esc>:source .session.vim<CR>v
as well as the following in my $HOME/.gitignore:
.session.vim
This lets me save a development session and open it later, which gives Neovim a more IDE-like feel.
bash
The relevant parts of my .bashrc are:
export GDBSETUP=".gdbsetup"

setupgdb()
{
	if [ -e "$GDBSETUP" -a ! -f "$GDBSETUP" ]; then
		printf '%s already exists and is not a file\n' "$GDBSETUP"
		exit 1
	fi

	local _setupgdb_tty=$(tty)

	printf 'dashboard -output %s\n' "$_setupgdb_tty" > "$GDBSETUP"
}
This creates a command setupgdb that sets up a terminal as output for
gdb-dashboard. Speaking of which…
gdb-dashboard
If Neovim is the keystone of my setup, then gdb-dashboard is the paint and
decorations that makes it nice to use.
gdb-dashboard has to be one of the best command-line tools I have ever used,
and it looks nice too! In the sneak peek picture, it is what is running the
entire right half of my screen.
gdb-dashboard is a .gdbinit file. It is basically a set of commands and
pre-defined settings for gdb to create a plugin.
If you already have a custom .gdbinit, do not fear; gdb-dashboard has a way
to import your own stuff.
To install gdb-dashboard, just copy the .gdbinit to your home directory.
If you want to add to gdb-dashboard, create a .gdbinit.d/ directory in your
home directory and put all of your stuff in there. Python files are loaded
first, in alphabetical order, then all other files are loaded, in alphabetical
order.
I have five files in .gdbinit.d/:
function.pymodules.pyautohooksinit
functions.py
This contains any Python functions I use in my gdb settings. At the moment, it
contains this:
import os

class FileExists(gdb.Function):
    """Returns true if a file exists, false otherwise."""

    def __init__(self):
        super(FileExists, self).__init__ ("file_exists")

    def invoke(self, name):
        try:
            namestr = name.string()
            ret = os.path.isfile(os.path.abspath(namestr))
        except:
            ret = False
        return ret

FileExists()
modules.py
This file contains my custom modules for gdb-dashboard. I have two: a
Breakpoints module and a custom Backtrace module (gdb-dashboard includes a
Stack module that I wasn’t quite satisfied with).
This file is over 300 lines long, so I won’t paste it here. However, you can download it here.
auto
This file sets up gdb-dashboard itself.
if $file_exists("./.gdbsetup")
    source .gdbsetup
end

dashboard -enabled on
dashboard -layout threads breakpoints assembly expressions !history !memory registers !source variables !stack backtrace
dashboard -style prompt 'gdb>'
dashboard -style max_value_length 0
dashboard variables -style compact False
dashboard variables -style align True
dashboard variables -style sort True
dashboard expressions -style align True
dashboard stack -style sort True

define expand
    dashboard -style compact_values False
end

define pack
    dashboard -style compact_values True
end

expand
The first three lines sources the file created by the setupgdb command I made
for bash. What it does is tell gdb-dashboard which terminal to output to. If
I didn’t have that, gdb-dashboard would just output to its own terminal,
crowding out everything in that tiny space.
The next set of lines basically set up my defaults for gdb-dashboard,
including which modules are shown and which are not. It sets a custom prompt as
well.
Then I define two commands, expand and pack. These control how
gdb-dashboard outputs data. (We will see those in use later.) Then I use
expand to set a default.
hooks
gdb has hooks, which allows users to set commands that are always run before
or after a command. I use them to make sure that gdb-dashboard is always run
after every command.
The file is simple, though repetitive:
define hookpost-up
    dashboard
end

define hookpost-down
    dashboard
end

define hookpost-frame
    dashboard
end

define hookpost-finish
    dashboard
end

define hookpost-return
    dashboard
end

define hook-quit
    set confirm off
end

define hookpost-enable
    dashboard
end

define hookpost-disable
    dashboard
end

define hookpost-break
    dashboard
end

define hookpost-tbreak
    dashboard
end

define hookpost-delete
    dashboard
end

define hookpost-watch
    dashboard
end

define hookpost-rwatch
    dashboard
end

define hookpost-awatch
    dashboard
end

define hookpost-condition
    dashboard
end

define hookpost-core-file
    dashboard
end

define hookpost-thread
    dashboard
end
init
This file is the last one that is run, and it only does a few things.
set print pretty on

define lb
    set breakpoint pending on
    source .gdbbreakpoints
    echo breakpoints loaded\n
    set breakpoint pending auto
end

define sb
    save breakpoints .gdbbreakpoints
    echo breakpoints saved\n
end
First, it tells gdb to make sure pretty printing is on. Then it defines two
commands, one to save the current set of breakpoints to a file, and one to load
them.
Do you remember my :GdbLoadBreakpoints and :GdbSaveBreakpoints commands in
Neovim? They correspond directly with the commands lb and sb defined in
init. This allows me to save the breakpoints that I used in a debugging
session and reuse them later. This reduces the amount of busywork I have to do
to get gdb back to where it was the last time I used it.
gdb
Of course, if I am going to use gdb-dashboard, it kinda makes it necessary to
use gdb. In fact, so much of this setup, including gdb-dashboard, is
dependent on gdb’s Python API.
But the files I use are all defined under gdb-dashboard, so I will quickly
move to…
tmux
If Neovim is the keystone of my setup, and gdb-dashboard is the paint, then
tmux is the foundation.
tmux is the tool that allows me to basically turn my terminal into a
replacement for an IDE-like experience.
My .tmux.conf is mostly about plugins and looks, which don’t matter as much,
but you can see it here.
However, that is not all I use for tmux. I also have some more code in my
.bashrc to use tmux:
if `command -v tmux > /dev/null`; then
	[ -z "${TMUX+set}" ] || export SESSION=`tmux display-message -p '#S'`
fi

function quit
{
	if `command -v tmux > /dev/null`; then
		tmux kill-session -t $SESSION
	fi
}

function killdetached
{
	tmux list-sessions | grep -E -v '\(attached\)$' - | while IFS='\n' read line; do
		line="${line#*:}"
		tmux kill-session -t "${line%%:*}"
	done
}
quit allows me to quit an entire tmux session in one command, and
killdetached is for when I have rogue tmux sessions running. And it defines
$SESSION if the terminal is inside a tmux session.
tmuxp
The reason tmux works as the foundation, is because of tmuxp. tmuxp allows
me to automate the startup of all of these tools. If it weren’t for tmuxp,
there would be too much busywork in making everything work.
I have a folder in my home directory, .tmuxp/, where I store all of my project
configs. Here are a couple examples:
session_name: blog
start_directory: /home/gavin/<directory_hidden>/blog

windows:
  - window_name: editor
    layout: main-vertical
    panes:
      - vim
  - window_name: terminal
    layout: main-vertical
    panes:
      -
      - hugo serve --path-warnings --debug -D --disableFastRender --renderToDisk --forceSyncStatic --noHTTPCache --ignoreCache
The one above is for my blog. You can see that I open two windows, one for the
editor (Neovim, which is soft-linked to vim on my machine), which takes the
entire screen. The next window has two panes, one of which is empty (for any
commands I need to run by hand), and the other runs Hugo on my blog to let me
see the draft(s) in progress.
session_name: bc
start_directory: /home/gavin/<directory_hidden>/bc
windows:
- window_name: editor
layout: main-vertical
panes:
- vim
- window_name: terminal
layout: main-vertical
panes:
-
-
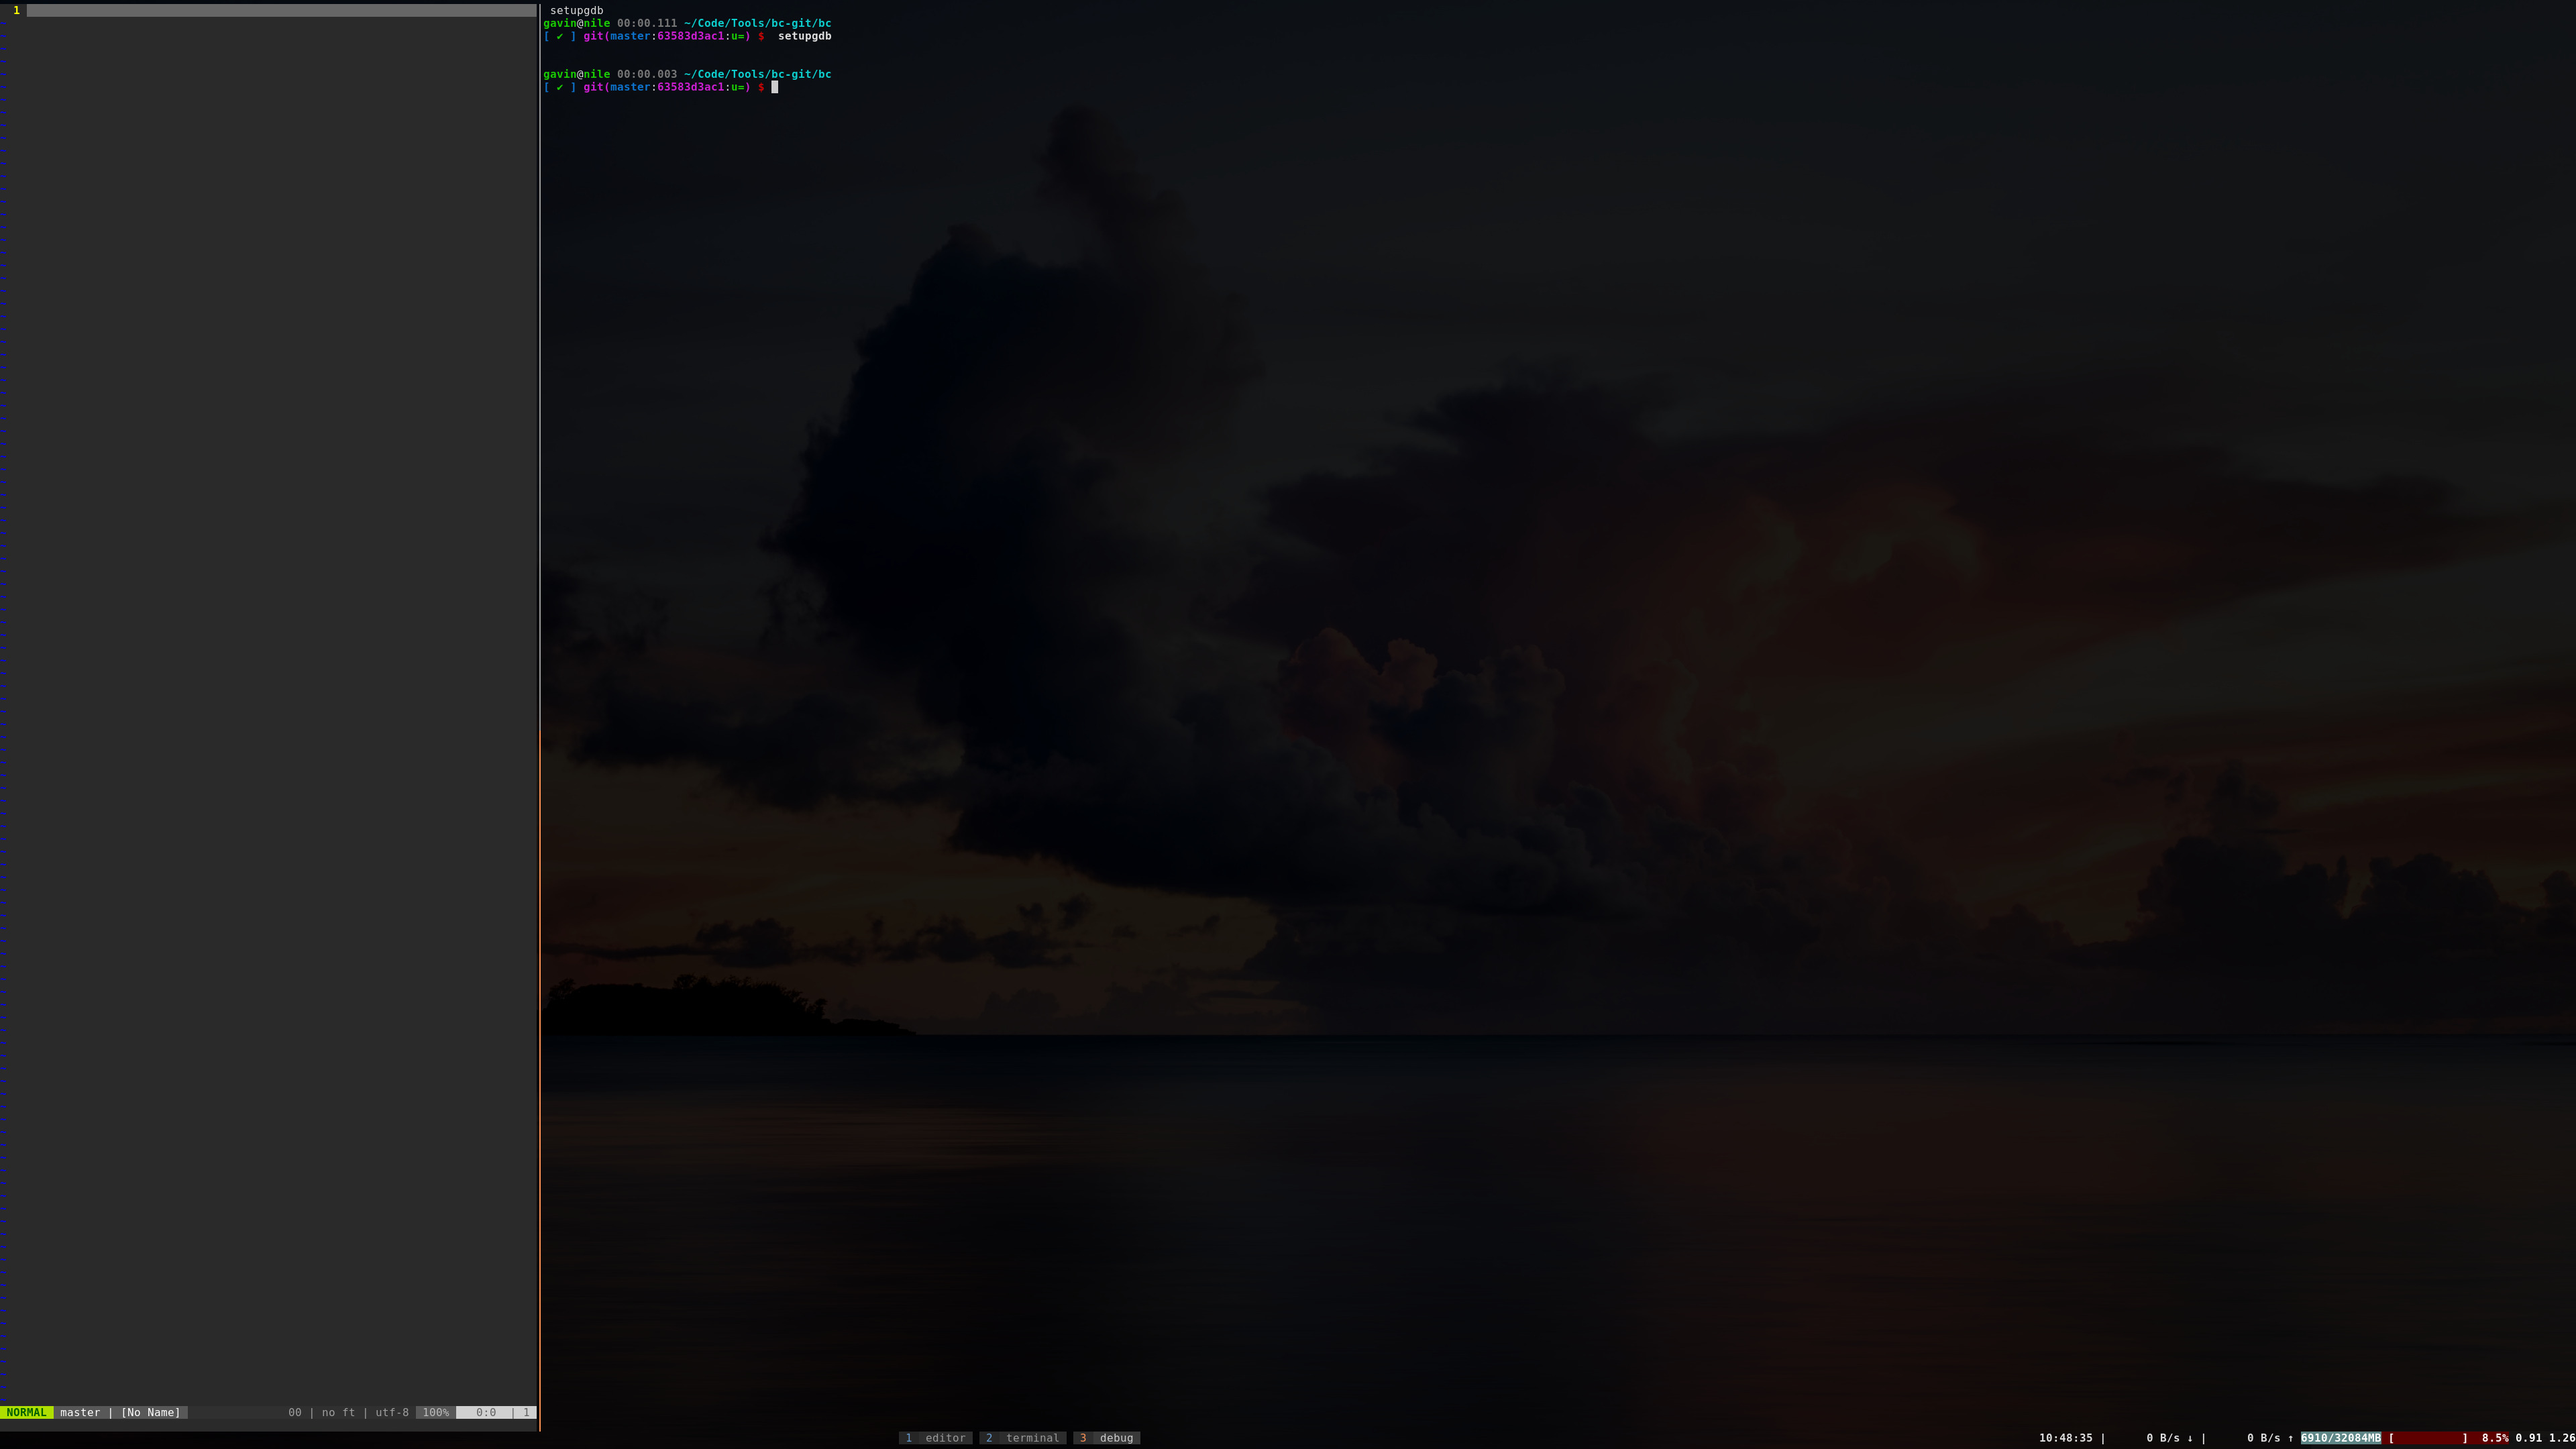
- window_name: debug
layout: main-vertical
panes:
- vim
- setupgdb
This one is for my bc, which you saw in the sneak peek.
It has three windows. The first is for the editor, like my blog. The second is two panes for running commands. The third is where the magic happens.
The third has two panes, one of which runs Neovim, and one of which runs my
setupgdb command from earlier. Thus, after telling tmuxp to start my bc
session, gdb-dashboard is already set up to output to a separate terminal, and
I have Neovim running to start the debugger.
But the niceties that tmuxp can give me don’t stop there.
I wrote the following and put it into my .bashrc:
eval "$(_TMUXP_COMPLETE=source tmuxp)"

_tmuxp_project_completions() {
	local word
	local files=$(ls $HOME/.tmuxp/${COMP_WORDS[1]}*.yaml 2> /dev/null)
	for f in $files; do
		COMPREPLY+=($(basename "$f" .yaml))
	done
	if [ "$COMP_CWORD" -gt 1 ]; then
		local offset=0
		for (( i=1; i < COMP_CWORD; i++ )); do
			word="${COMP_WORDS[i]}"
			if [ "$word" != -* ]; then
				offset=$(printf "$i + 1" | bc)
				break
			fi
		done
		if [ $offset -ne 0 ]; then
			COMPREPLY=()
			_command_offset "$offset"
		fi
	fi
}

alias mux='tmuxp load'
complete -F _tmuxp_project_completions mux
First, I run a command that tmuxp requires. Then I define a bash
completion function that basically searches my $HOME/.tmuxp folder for
configs. Then it uses those names, without the .yaml extensions, to do
completions.
After that, I define mux as an alias for tmuxp load and use the completion
function for mux.
What It Looks Like
Here is what a development session looks like.
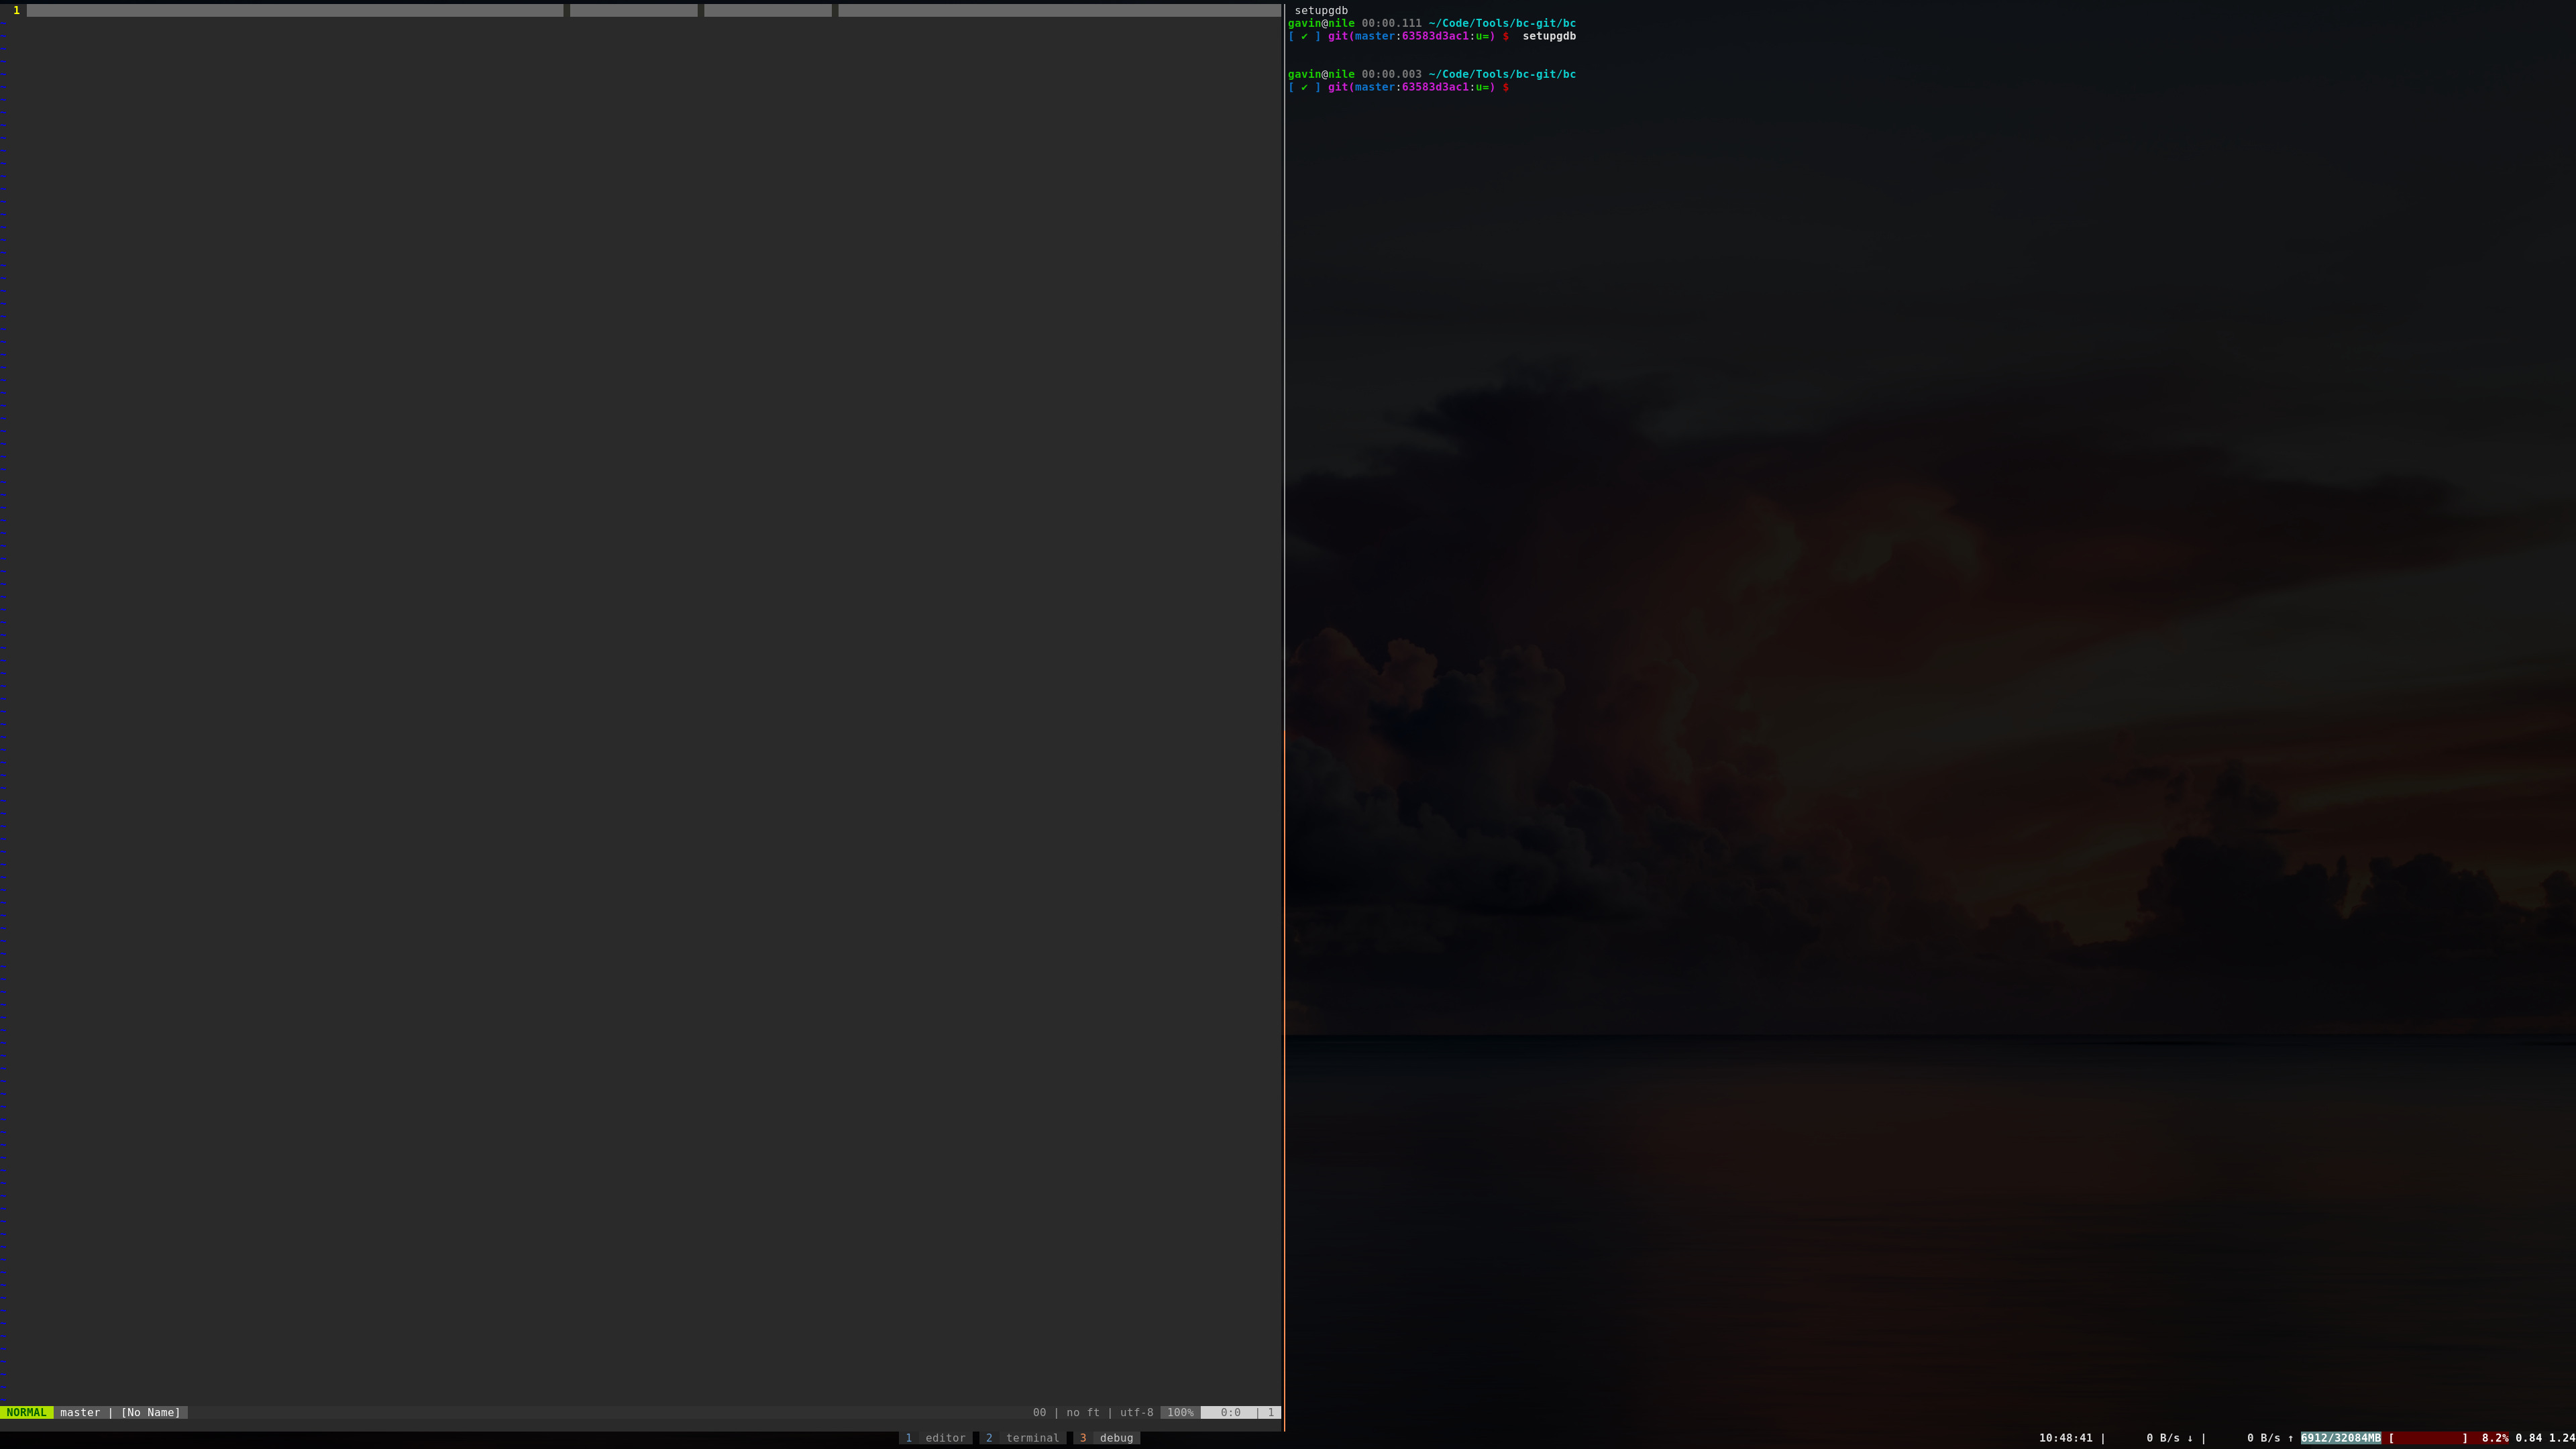
First, I open a terminal (fullscreen kitty for the curious) and run
mux <session_name>, mux bc in this case.

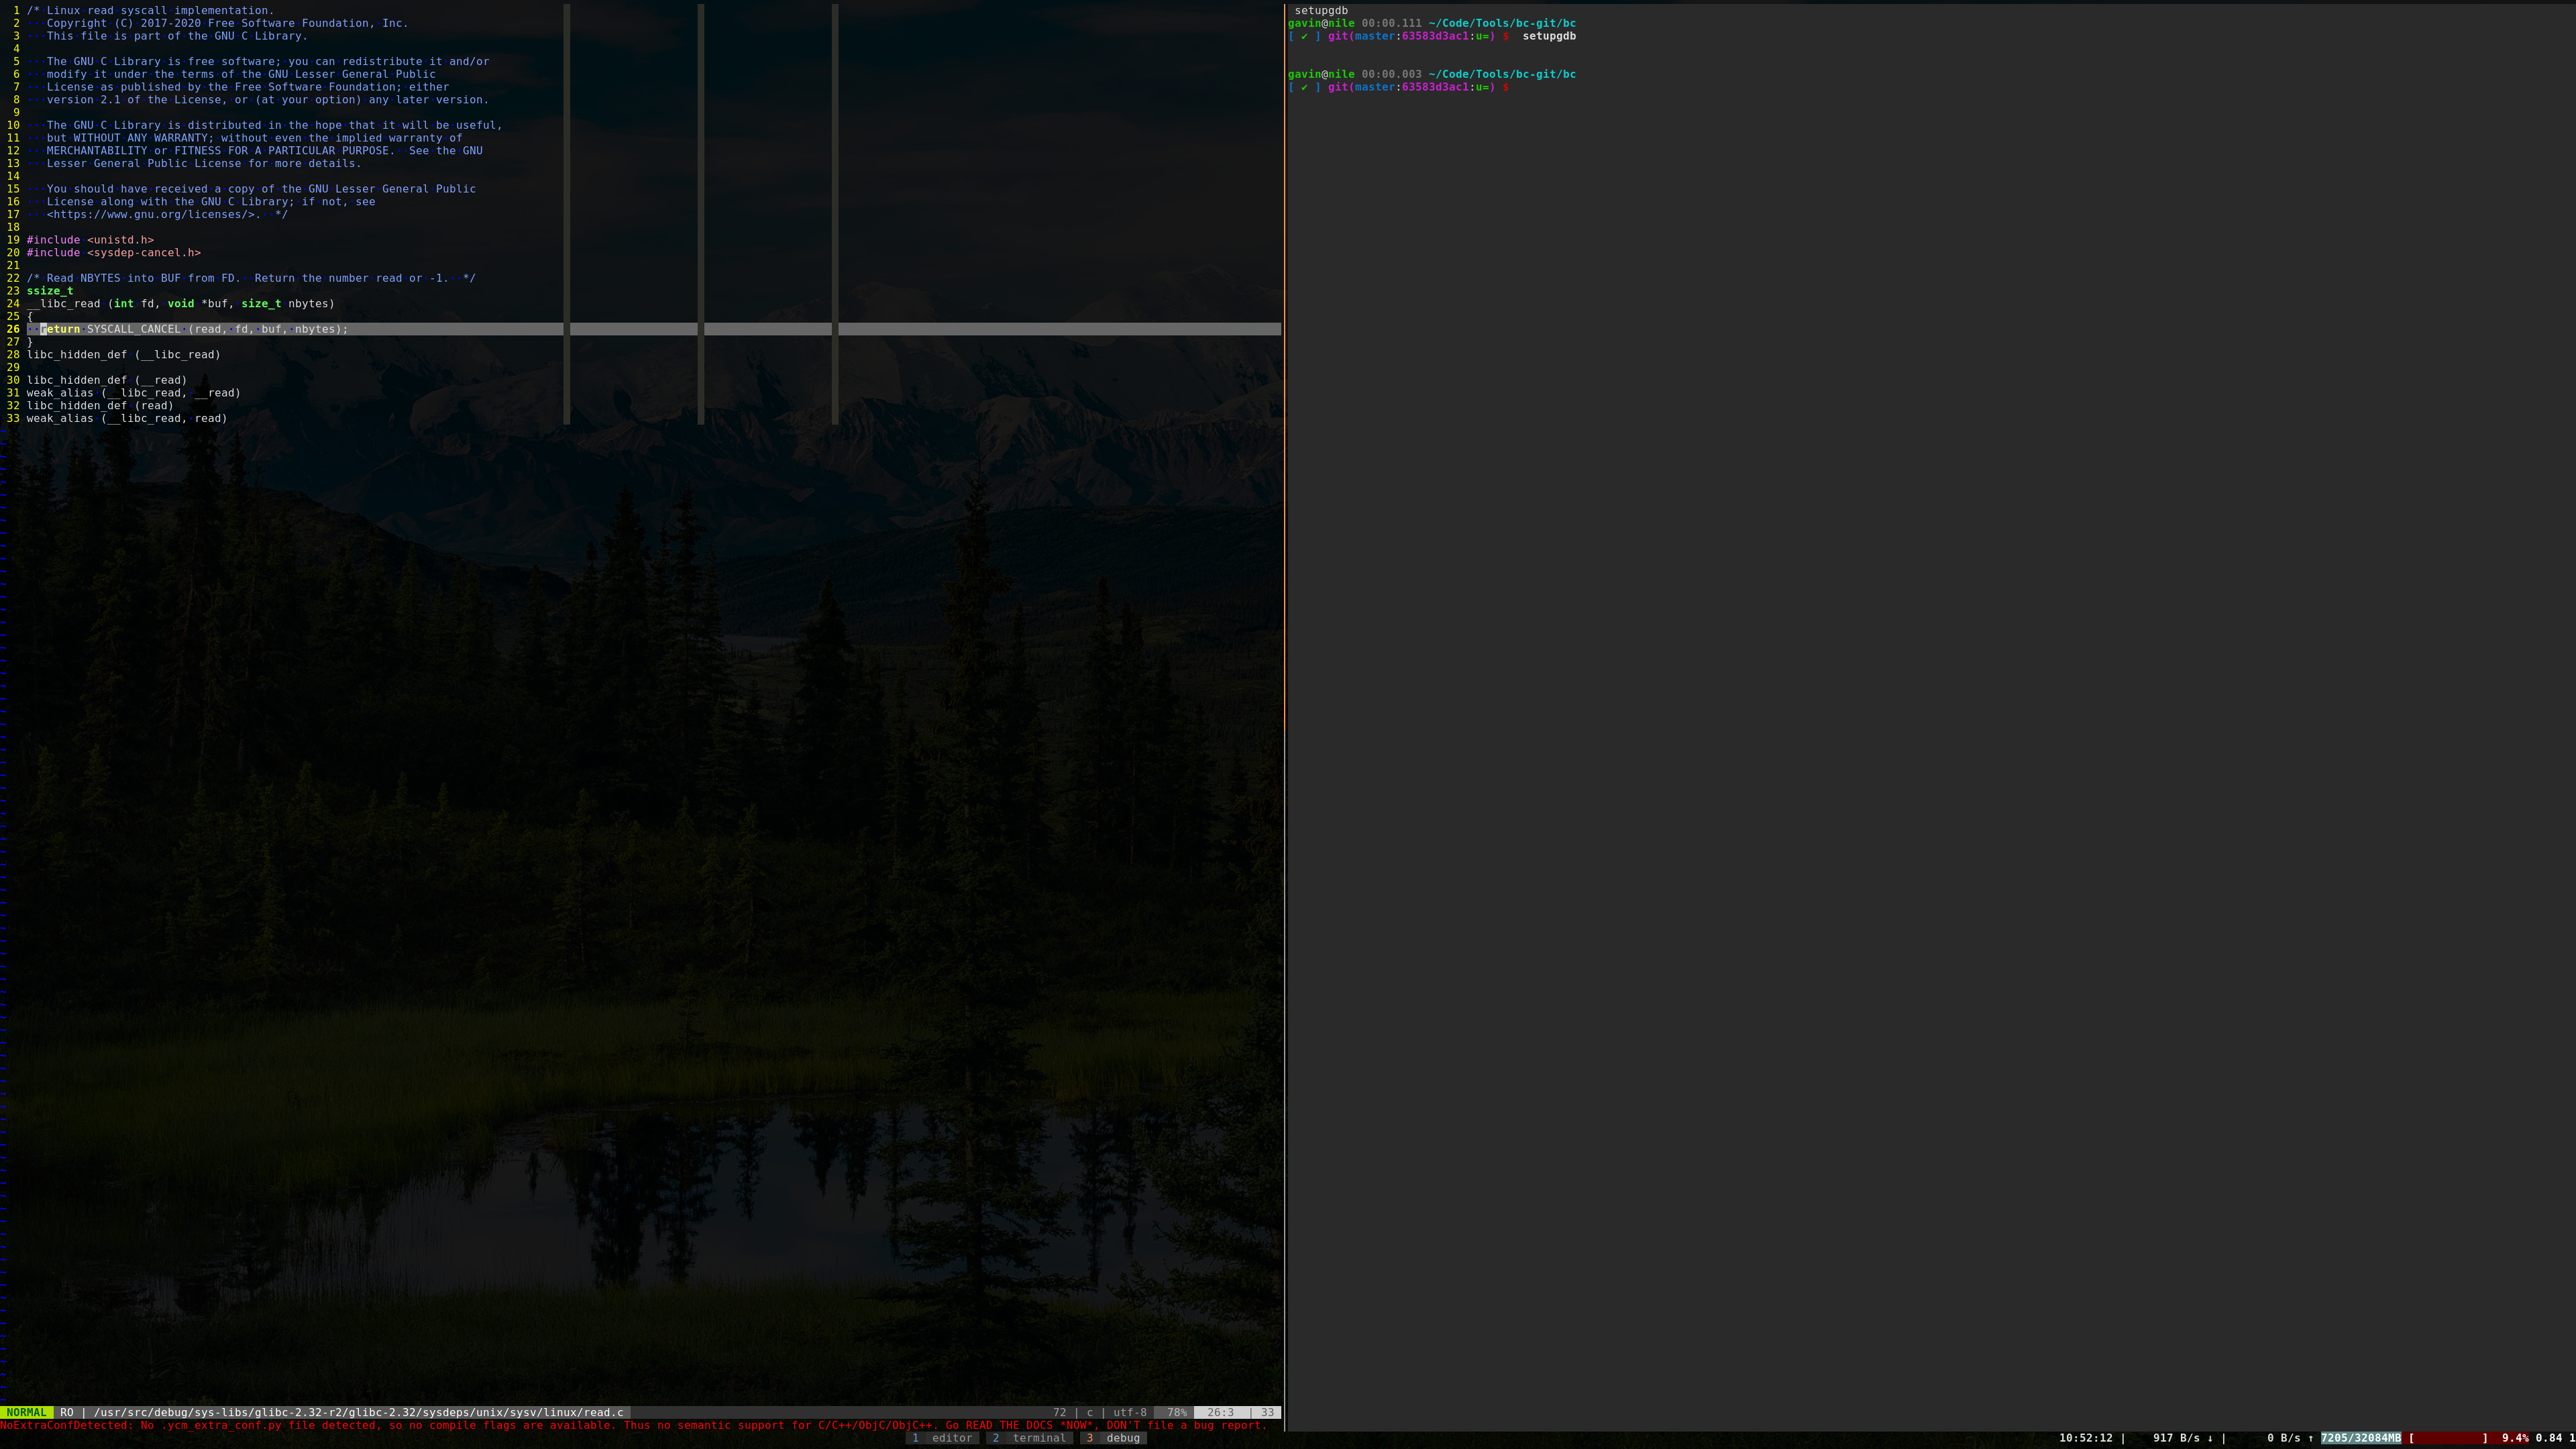
Once tmuxp loads tmux, I am greeted by Neovim.
Then I can use <Leader>so to open my previous development session.
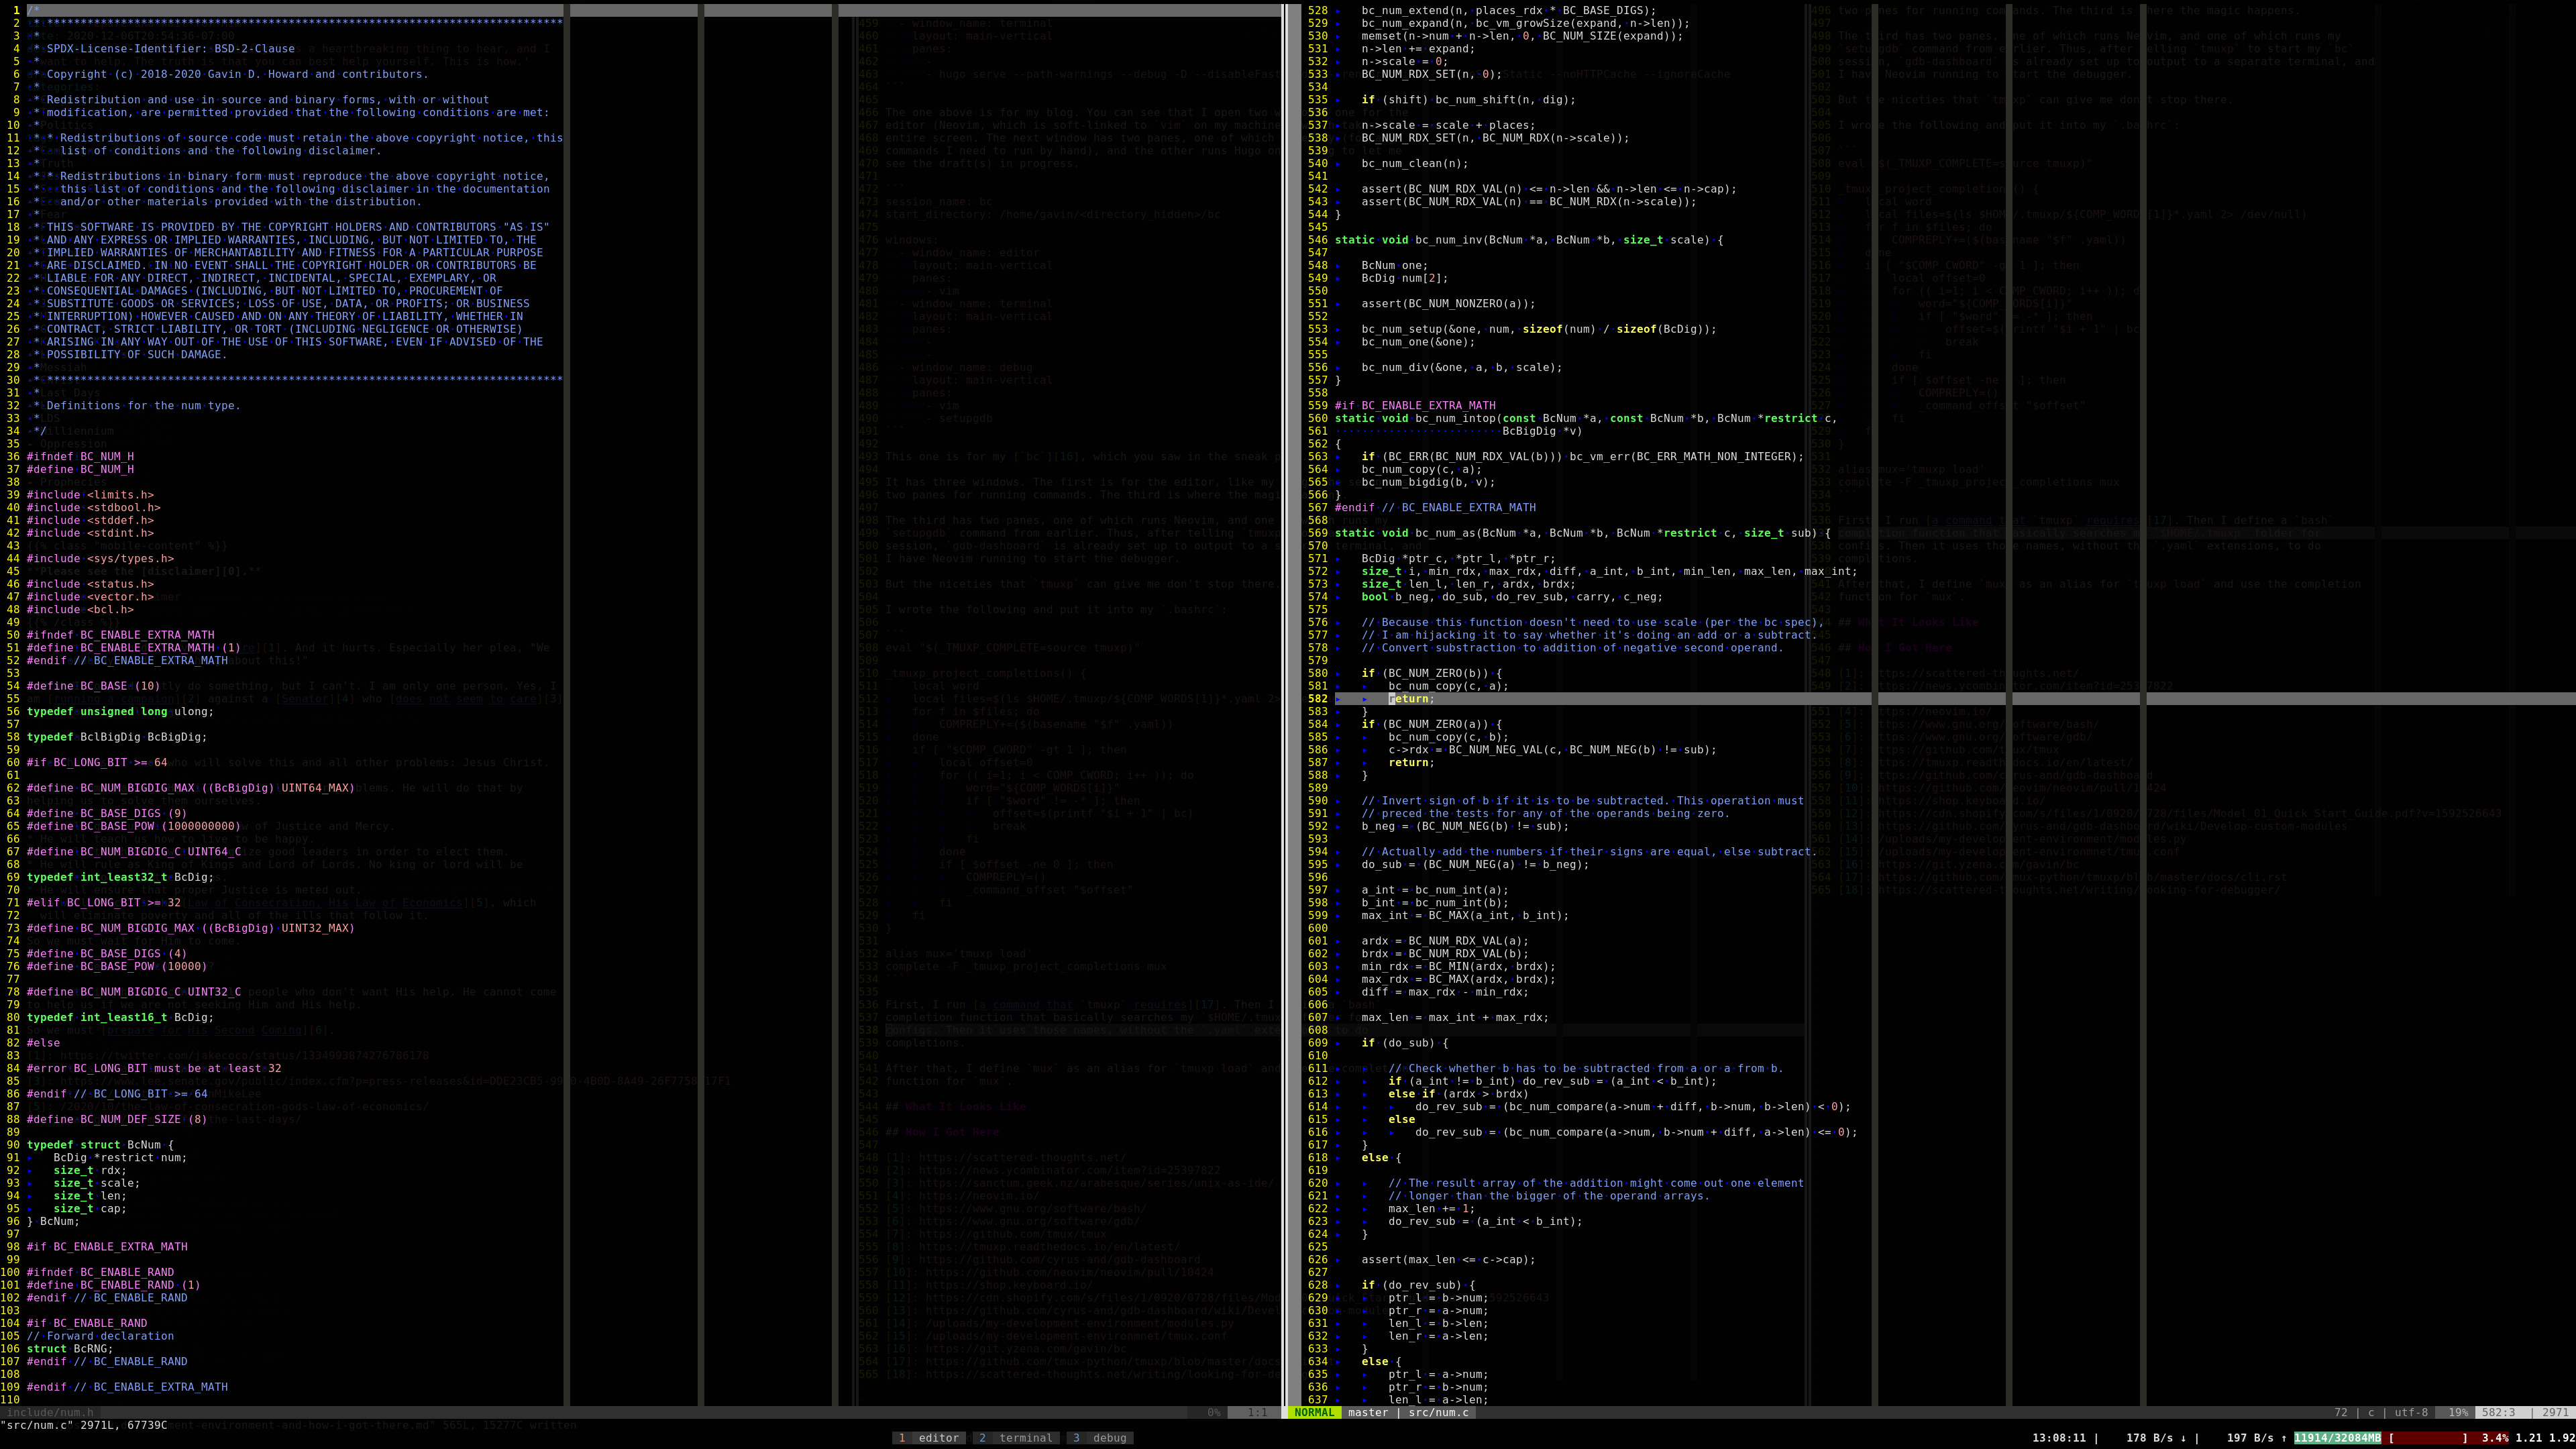
When I want to run commands, I can switch to the next tmux window.
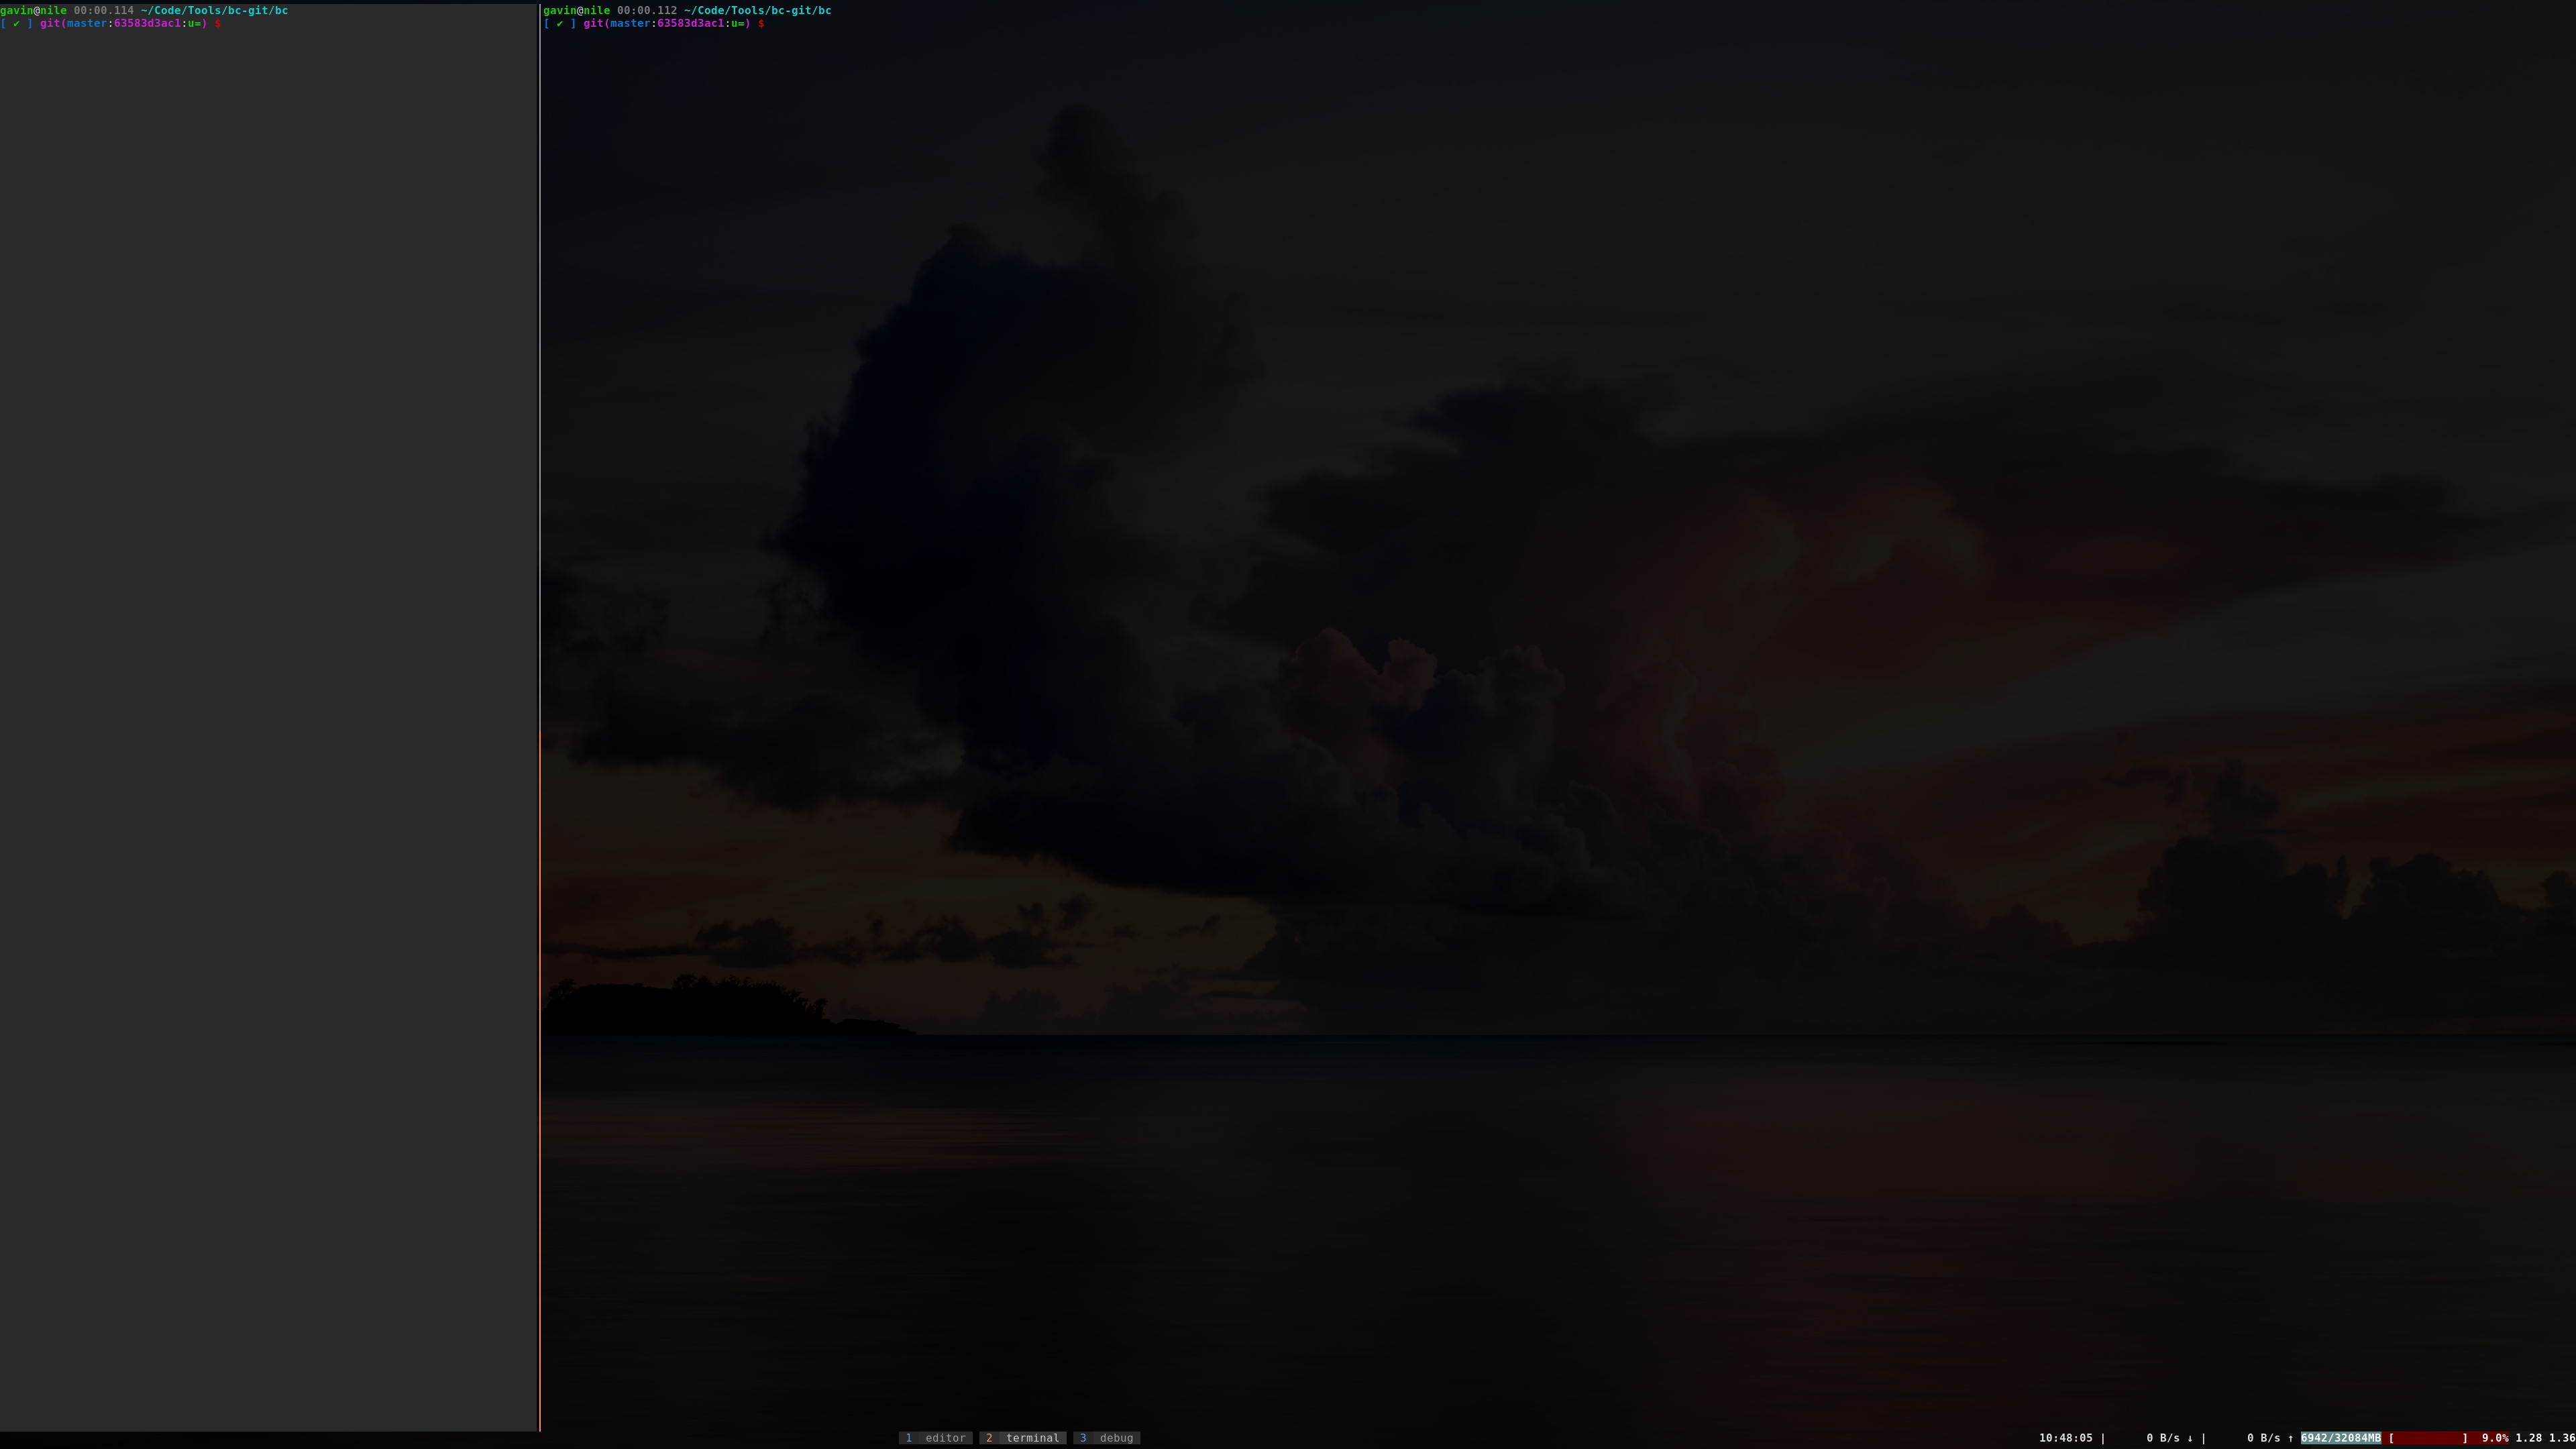
Unfortunately, tmuxp has a bug where the layout is not set up correctly, so
the split is too far to the left. I have a tmux key mapping to move it.
Update, 28 Jan 2021: I found out that if you switch the layouts from
main-vertical to even-horizontal, the bug goes away! I have already made the
switch everywhere, and I suggest you do too.
In this case, I need to build my bc, so I configure it.
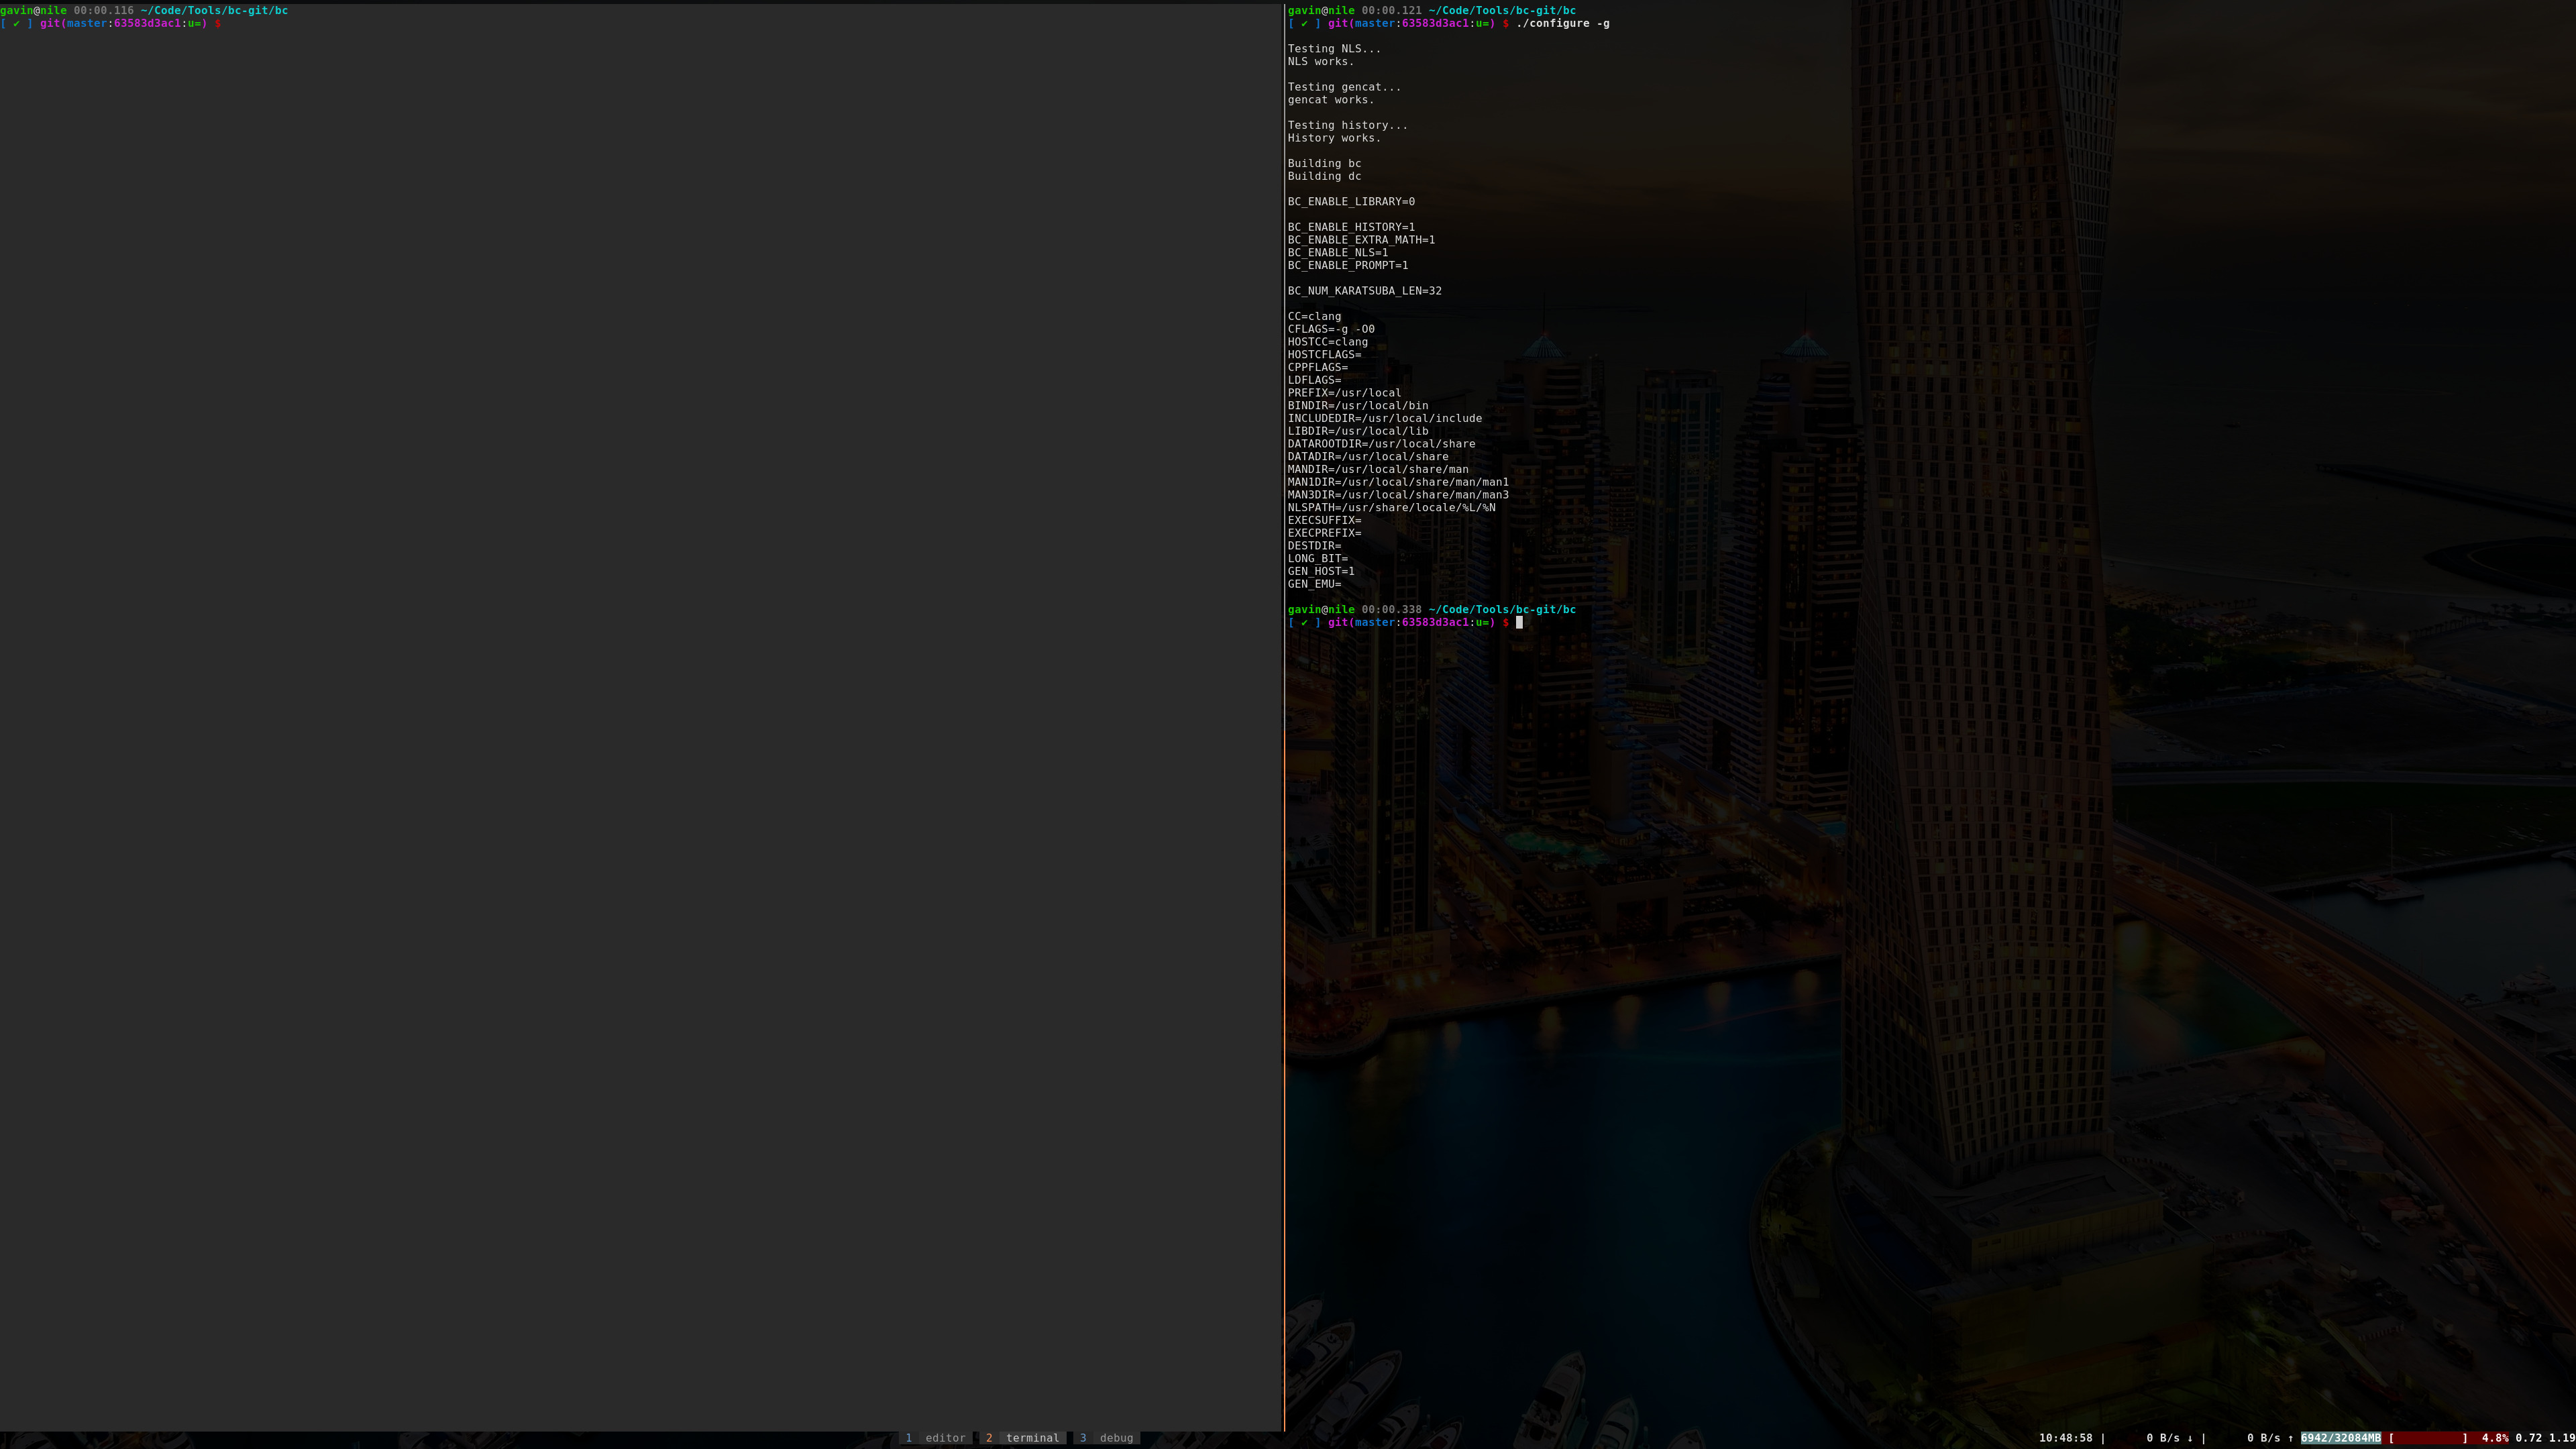
And build it.
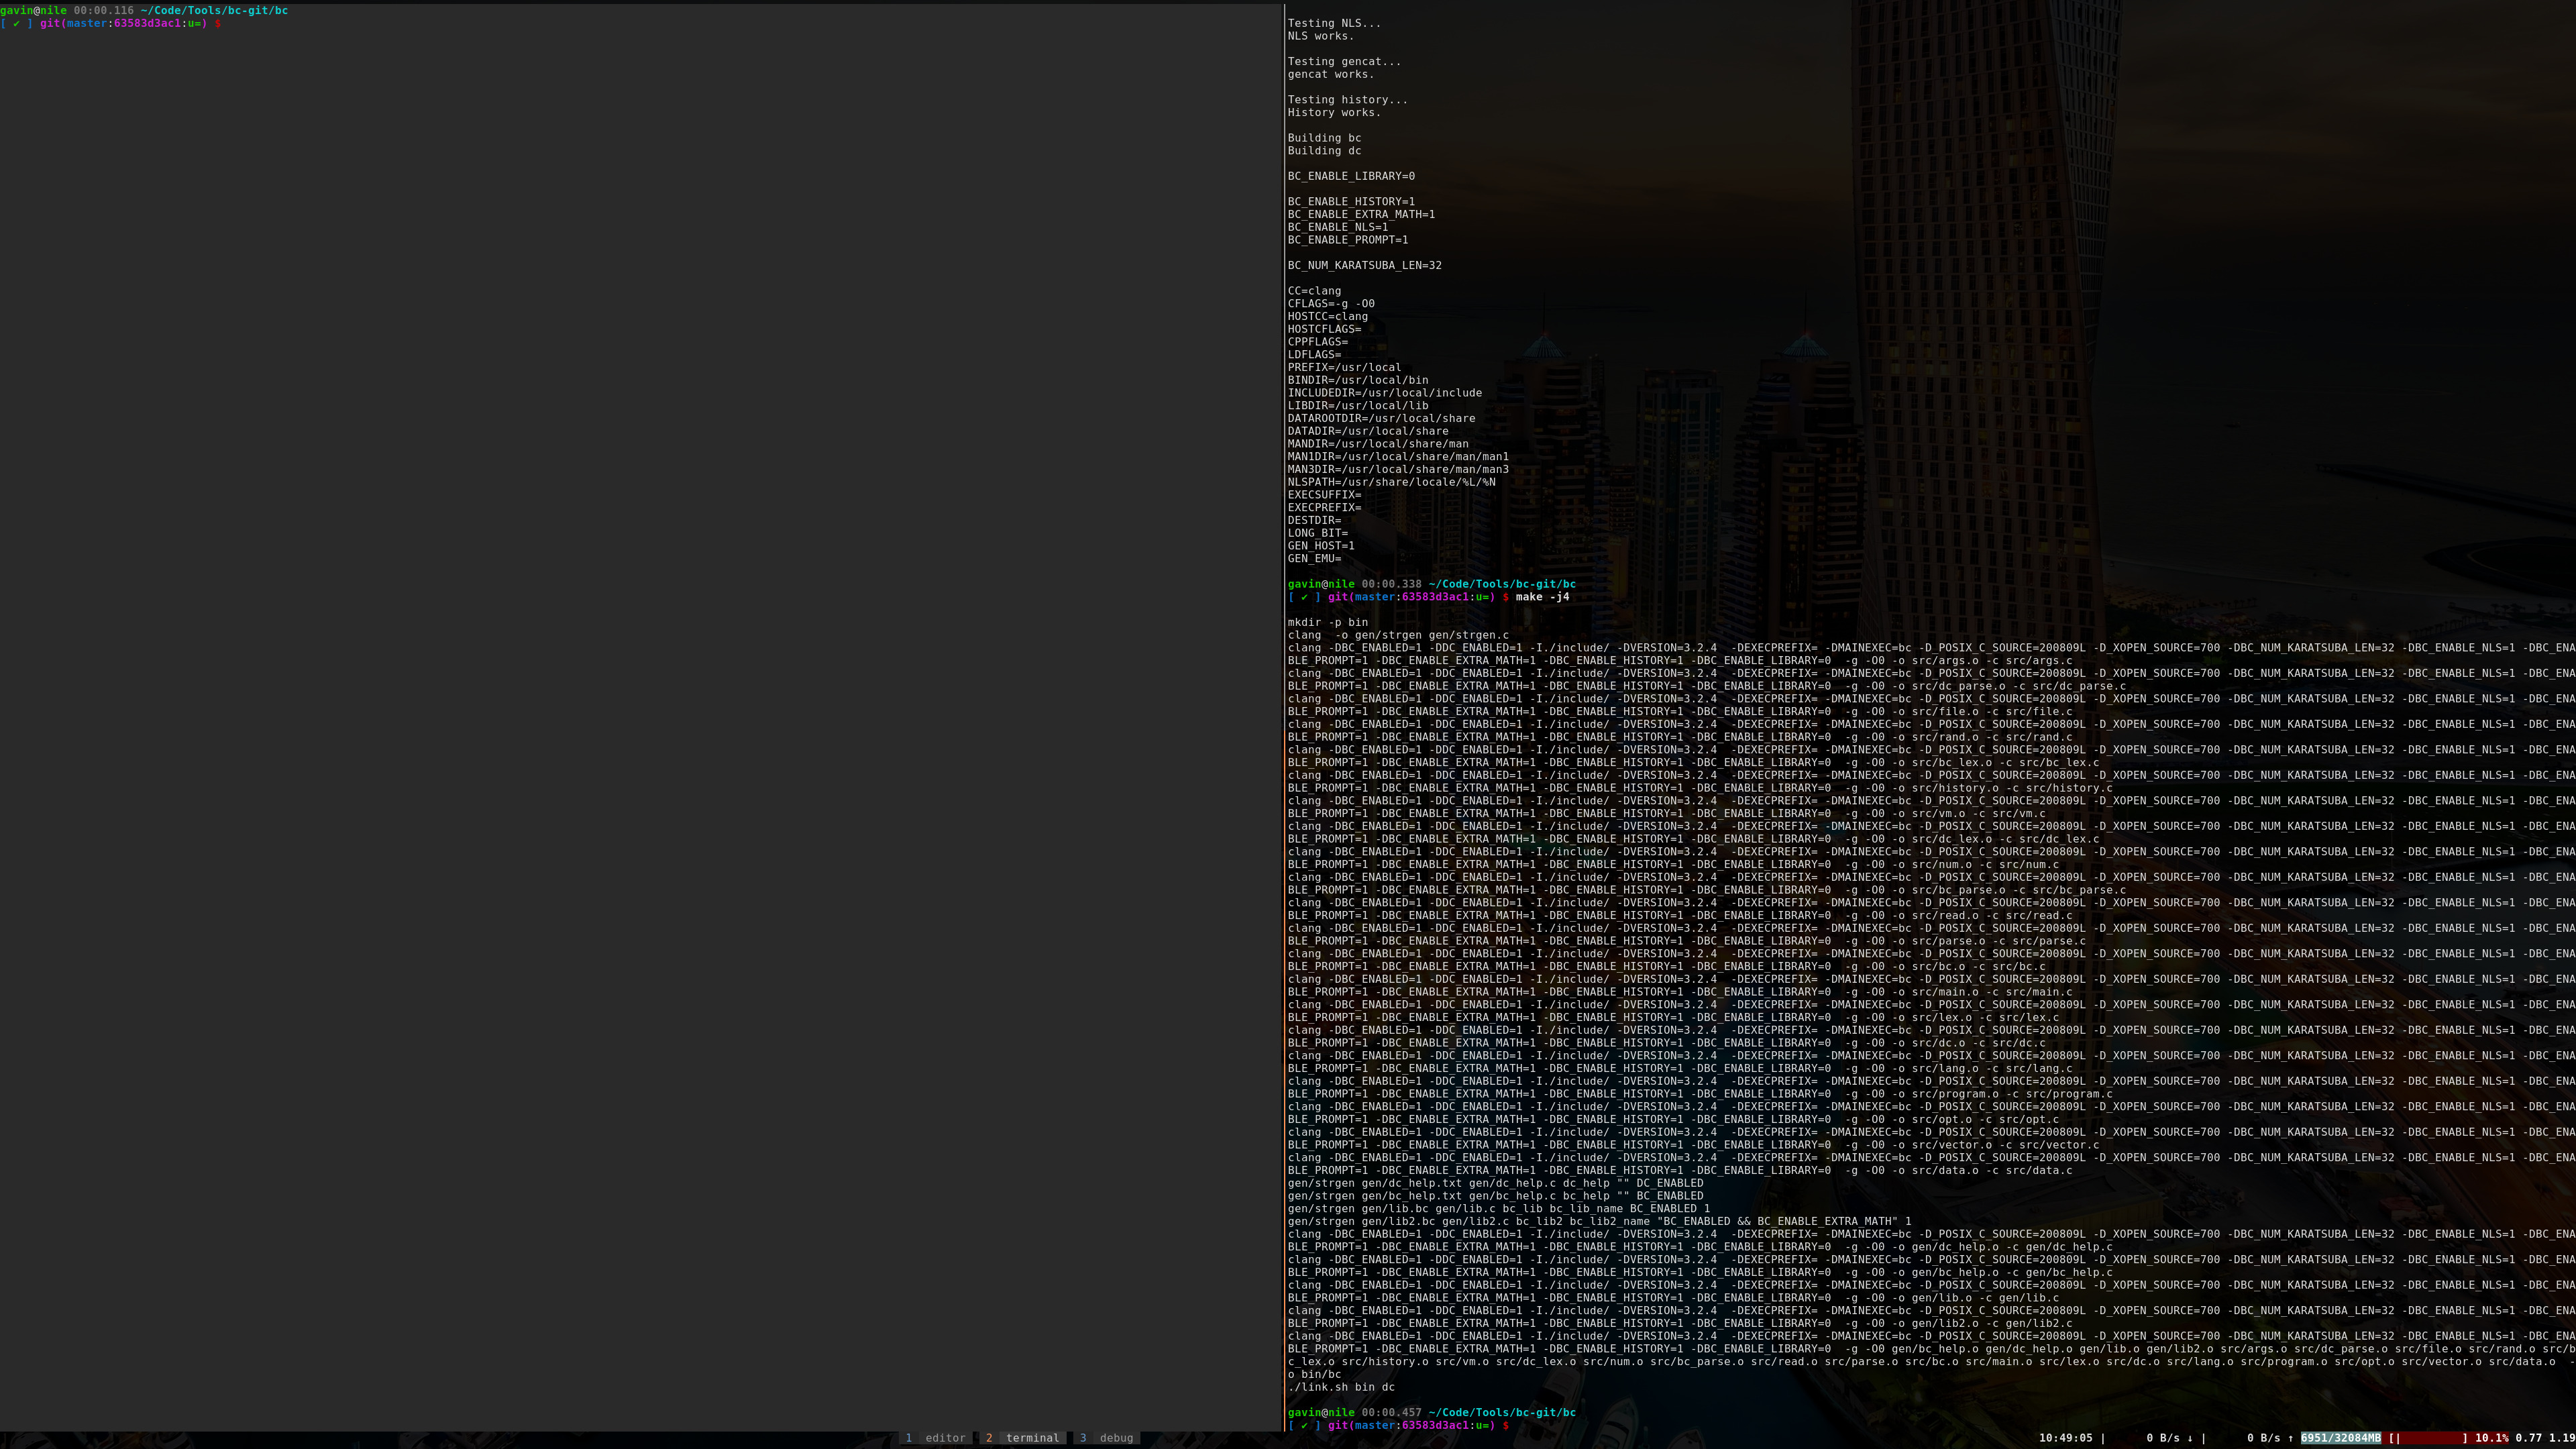
Then I can move to my debugging window.
Same tmuxp bug again; let’s move that.
Thank goodness we only have to do that once per tmux window per session…
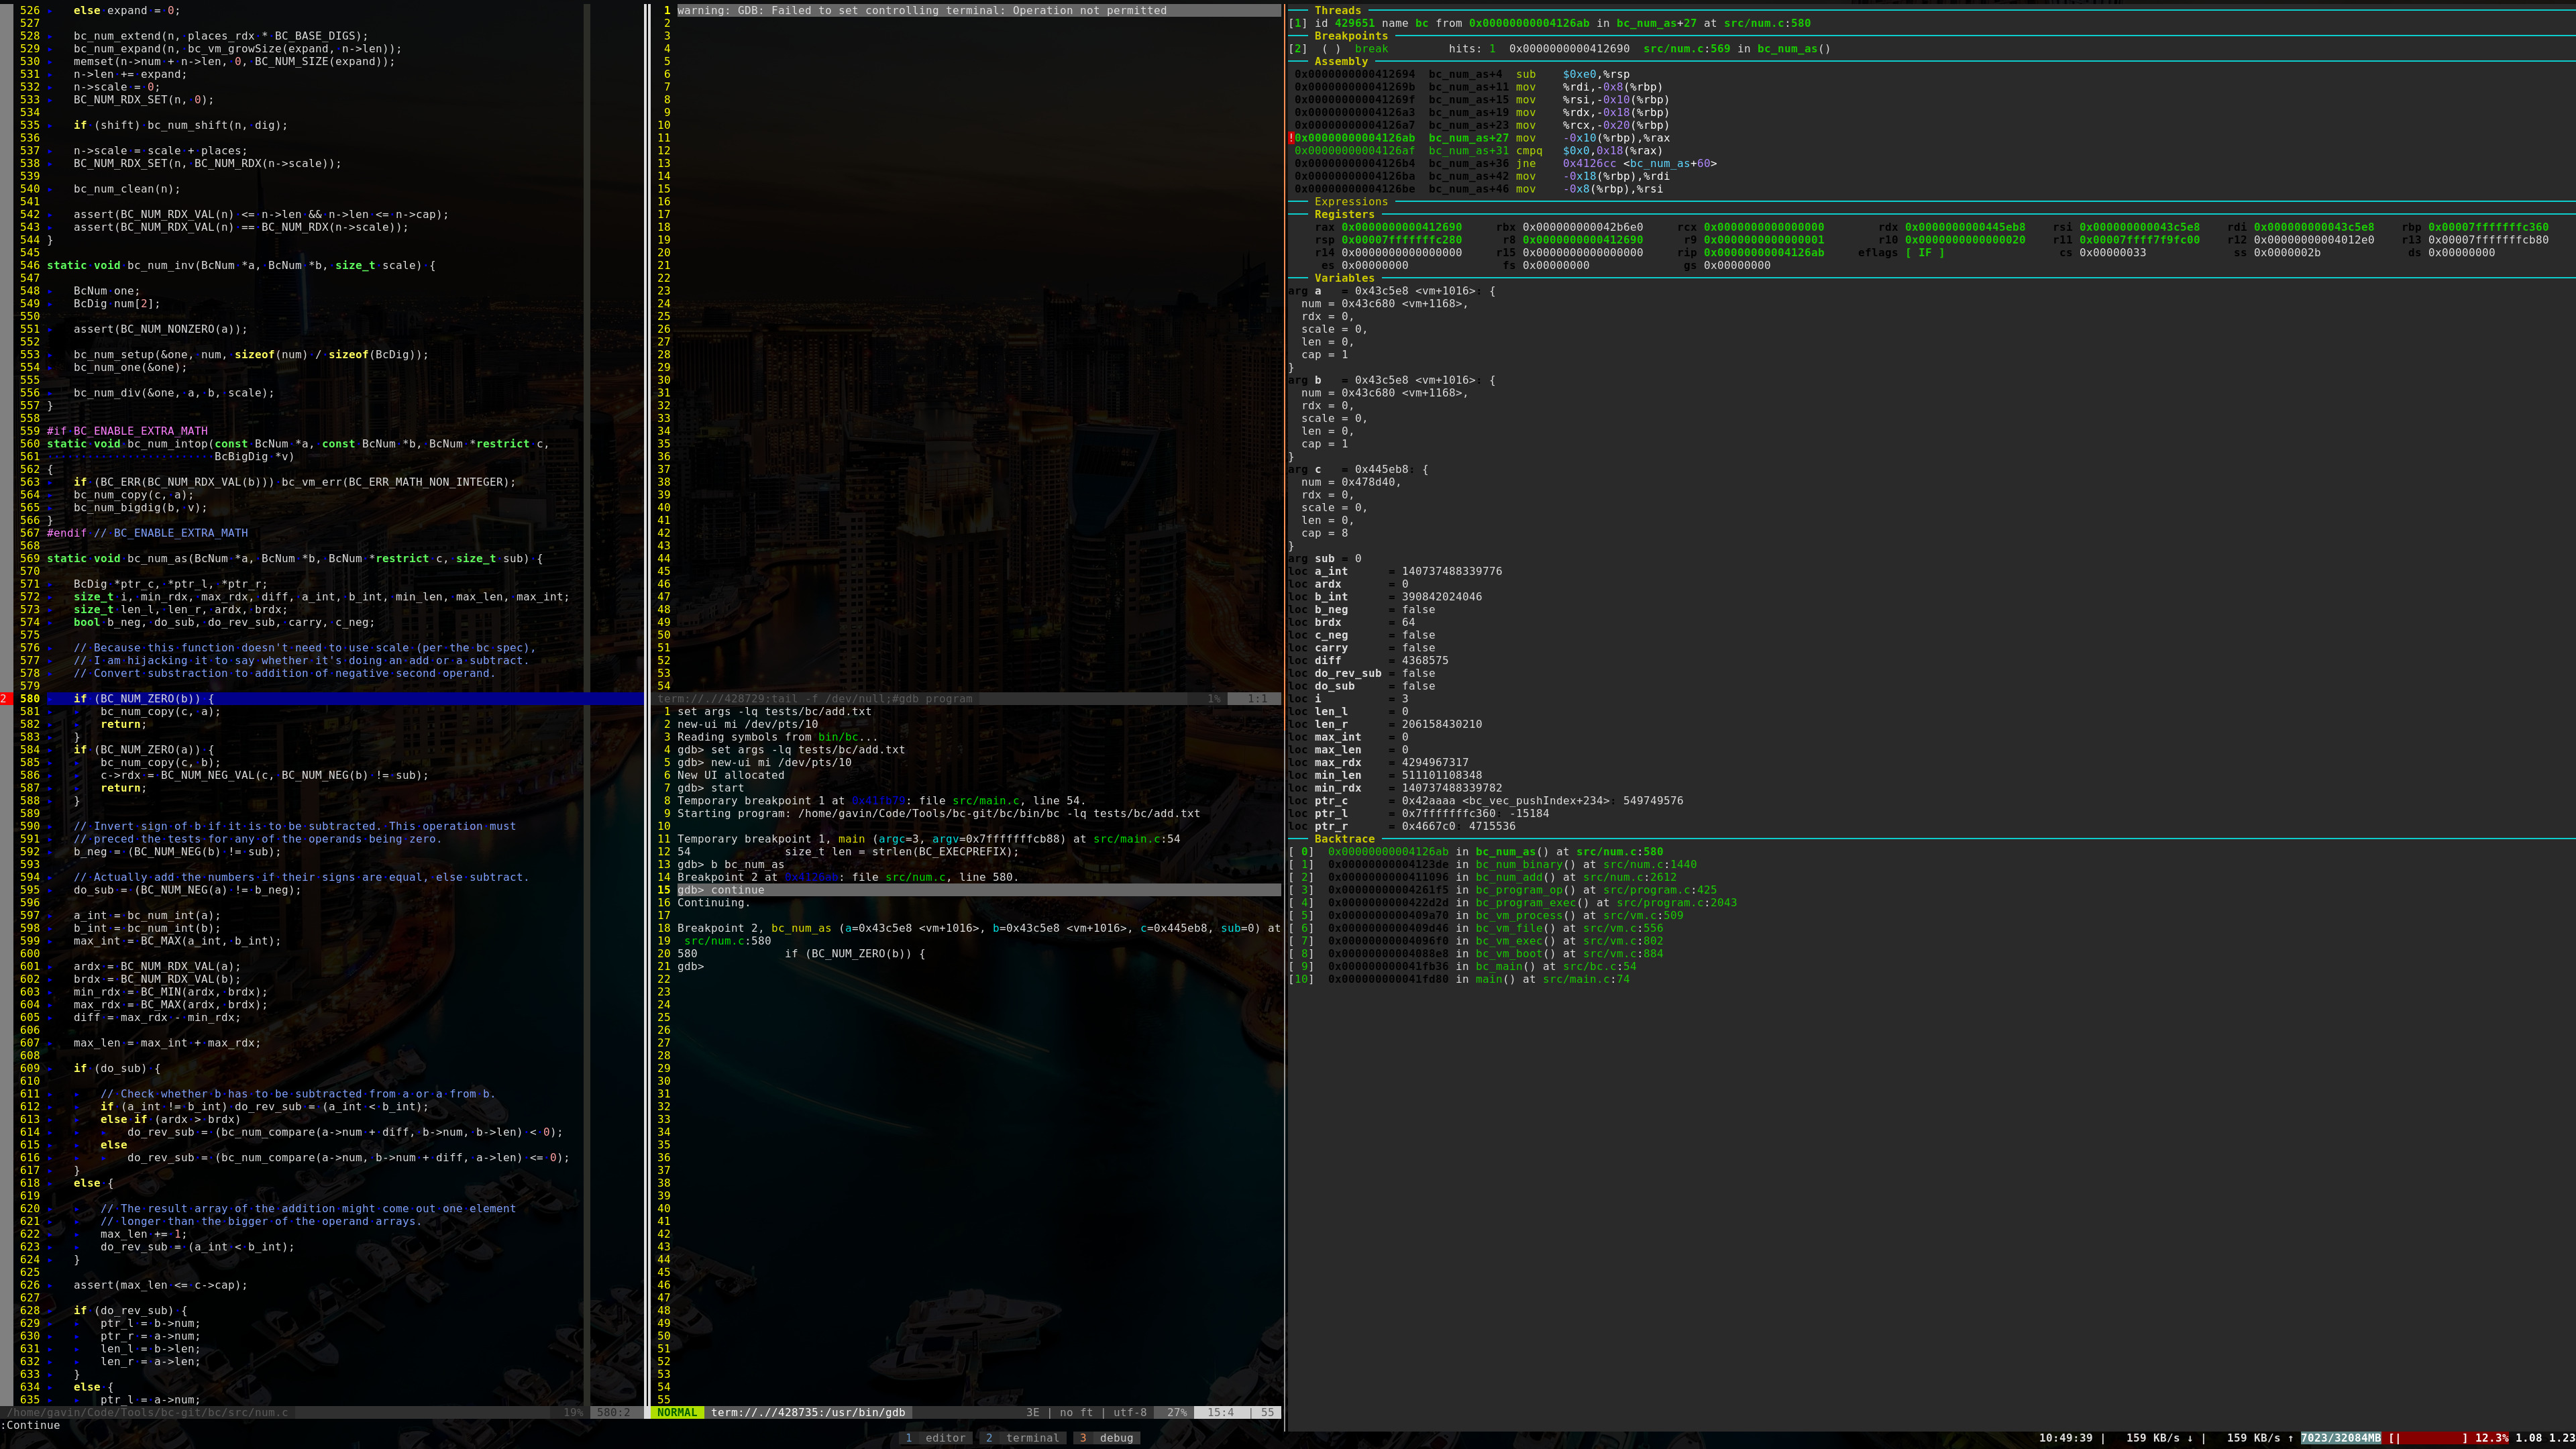
In this case, I want to debug my bc’s addition, so let’s start Neovim’s
terminal debugger with :TermdebugCommand bin/bc -lq tests/bc/add.txt, which I
can do by hand the first time, or by <Leader>. after that.
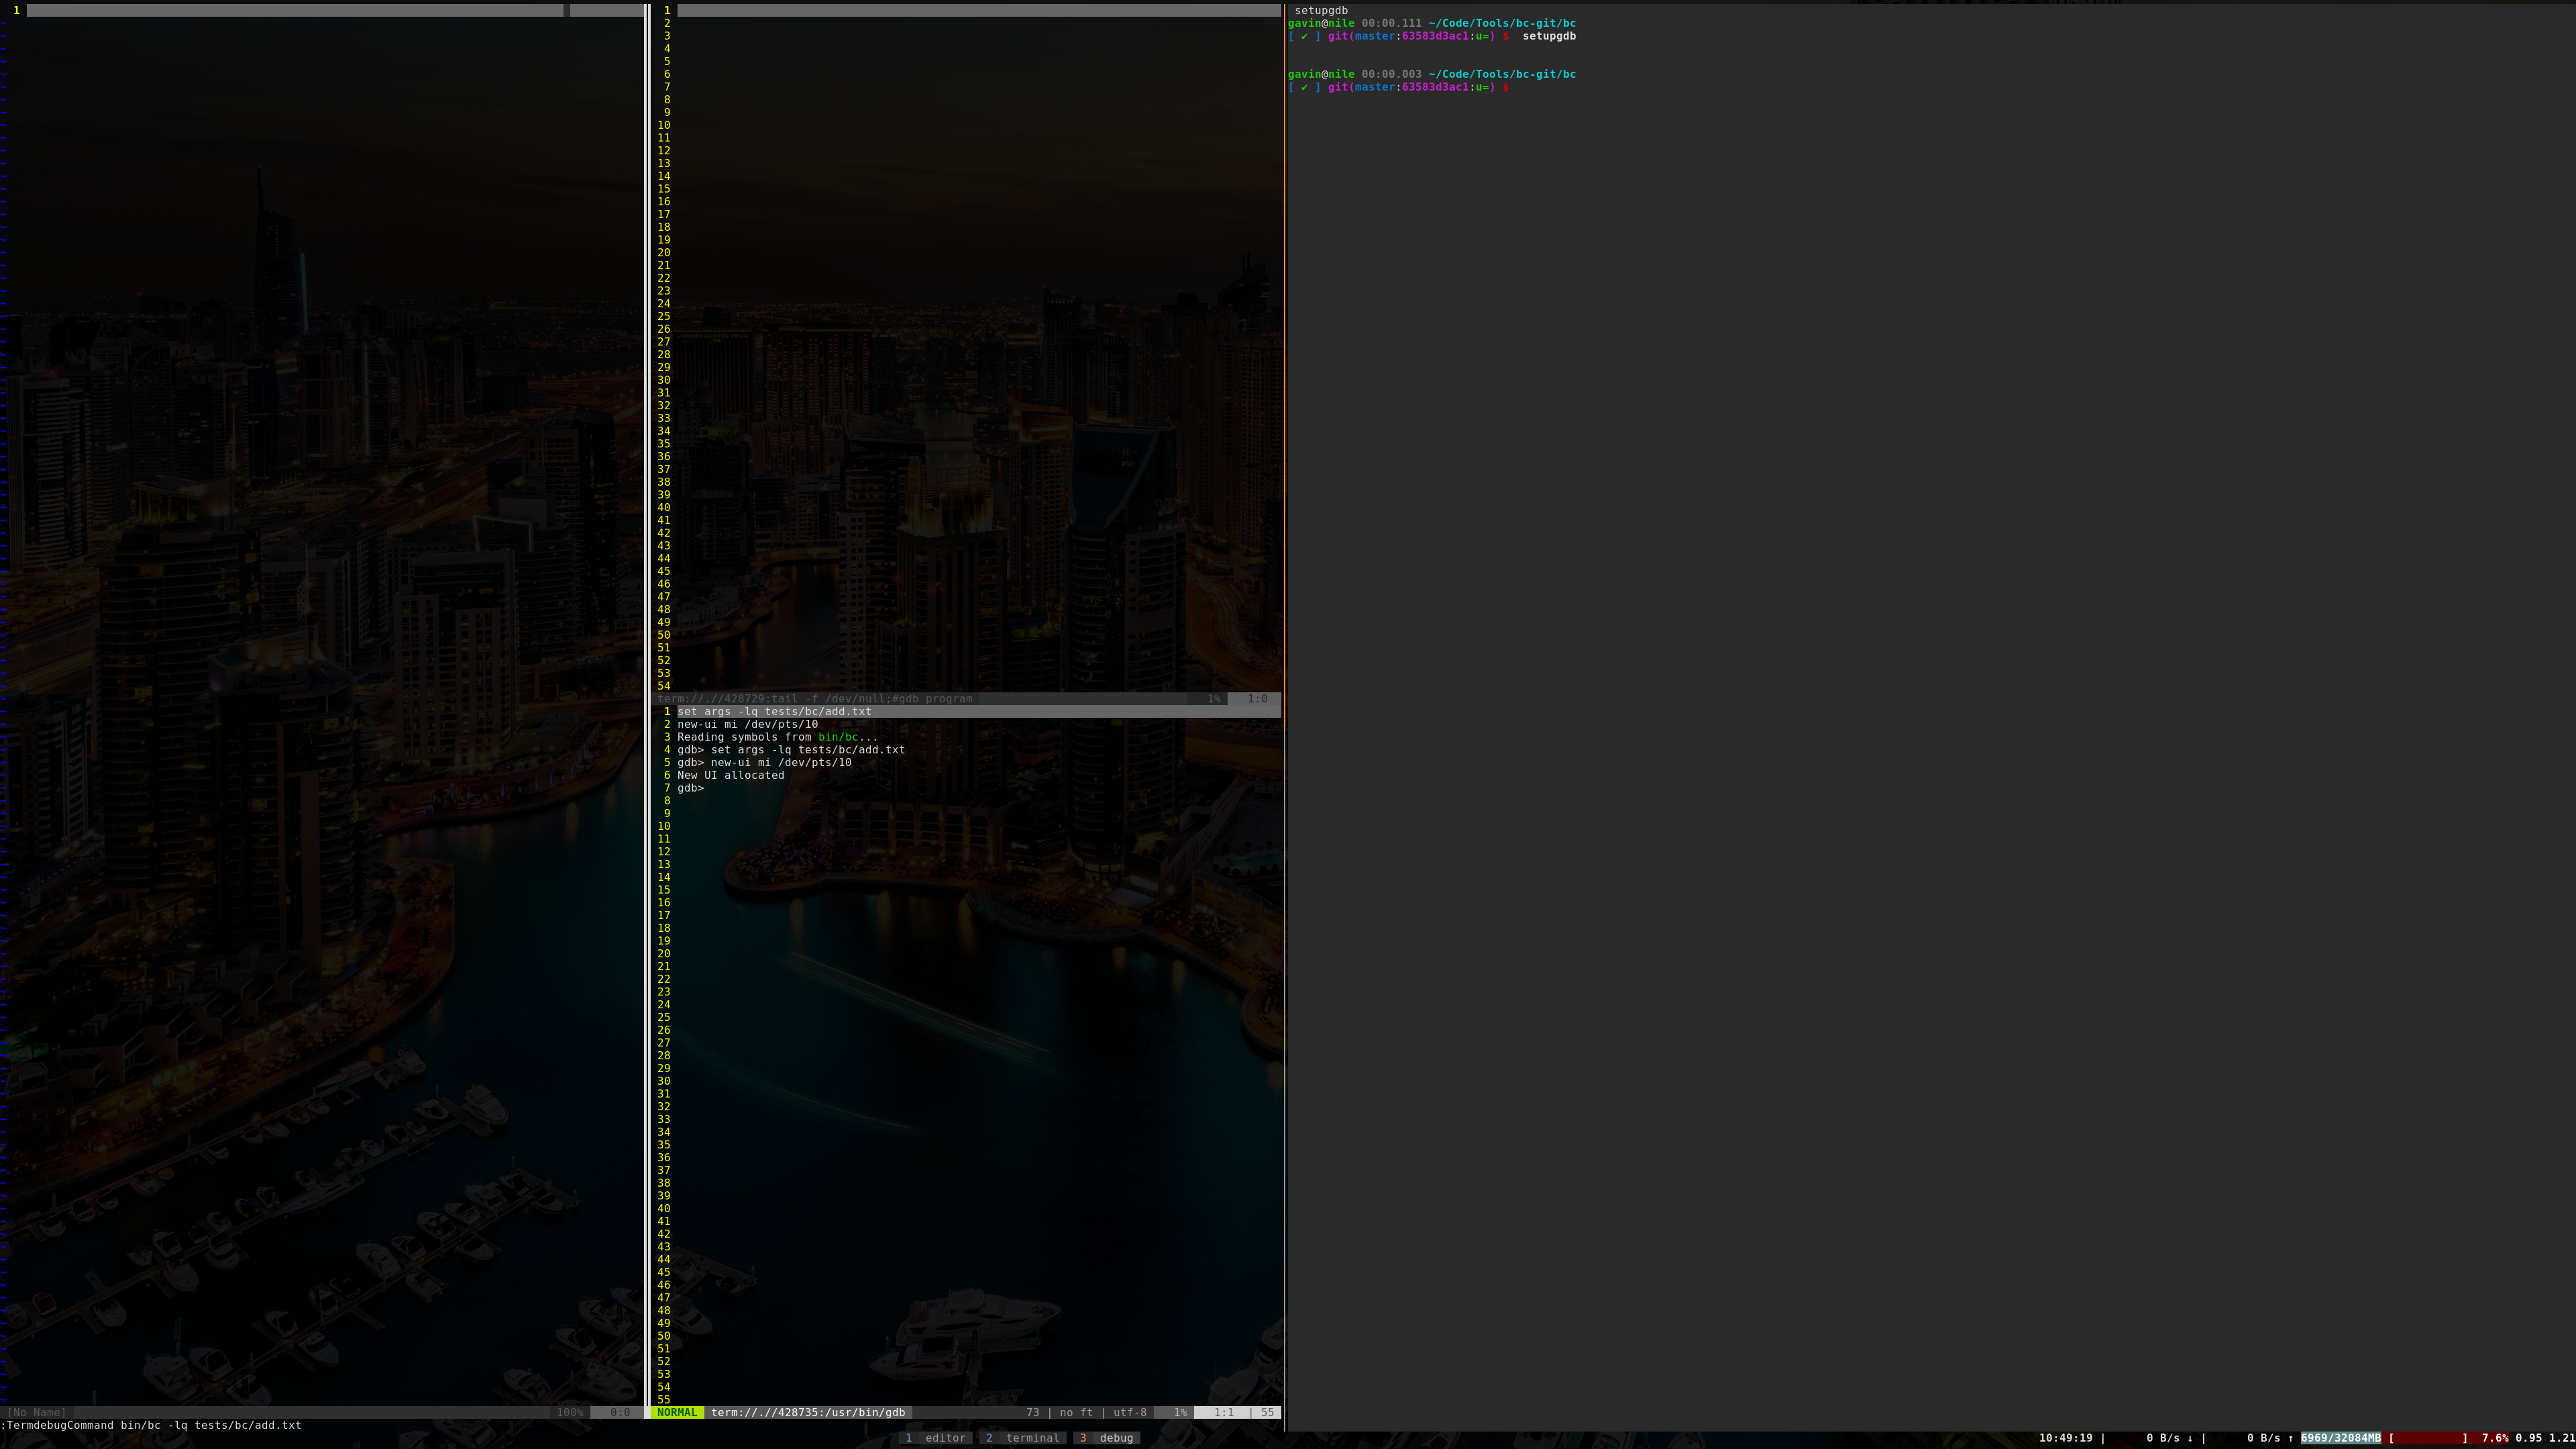
This opens up two extra panes in Neovim, one for the program output (center left
top) and one for controlling gdb (center left bottom).
After that, I need to start gdb, which I can do with <C-e>.
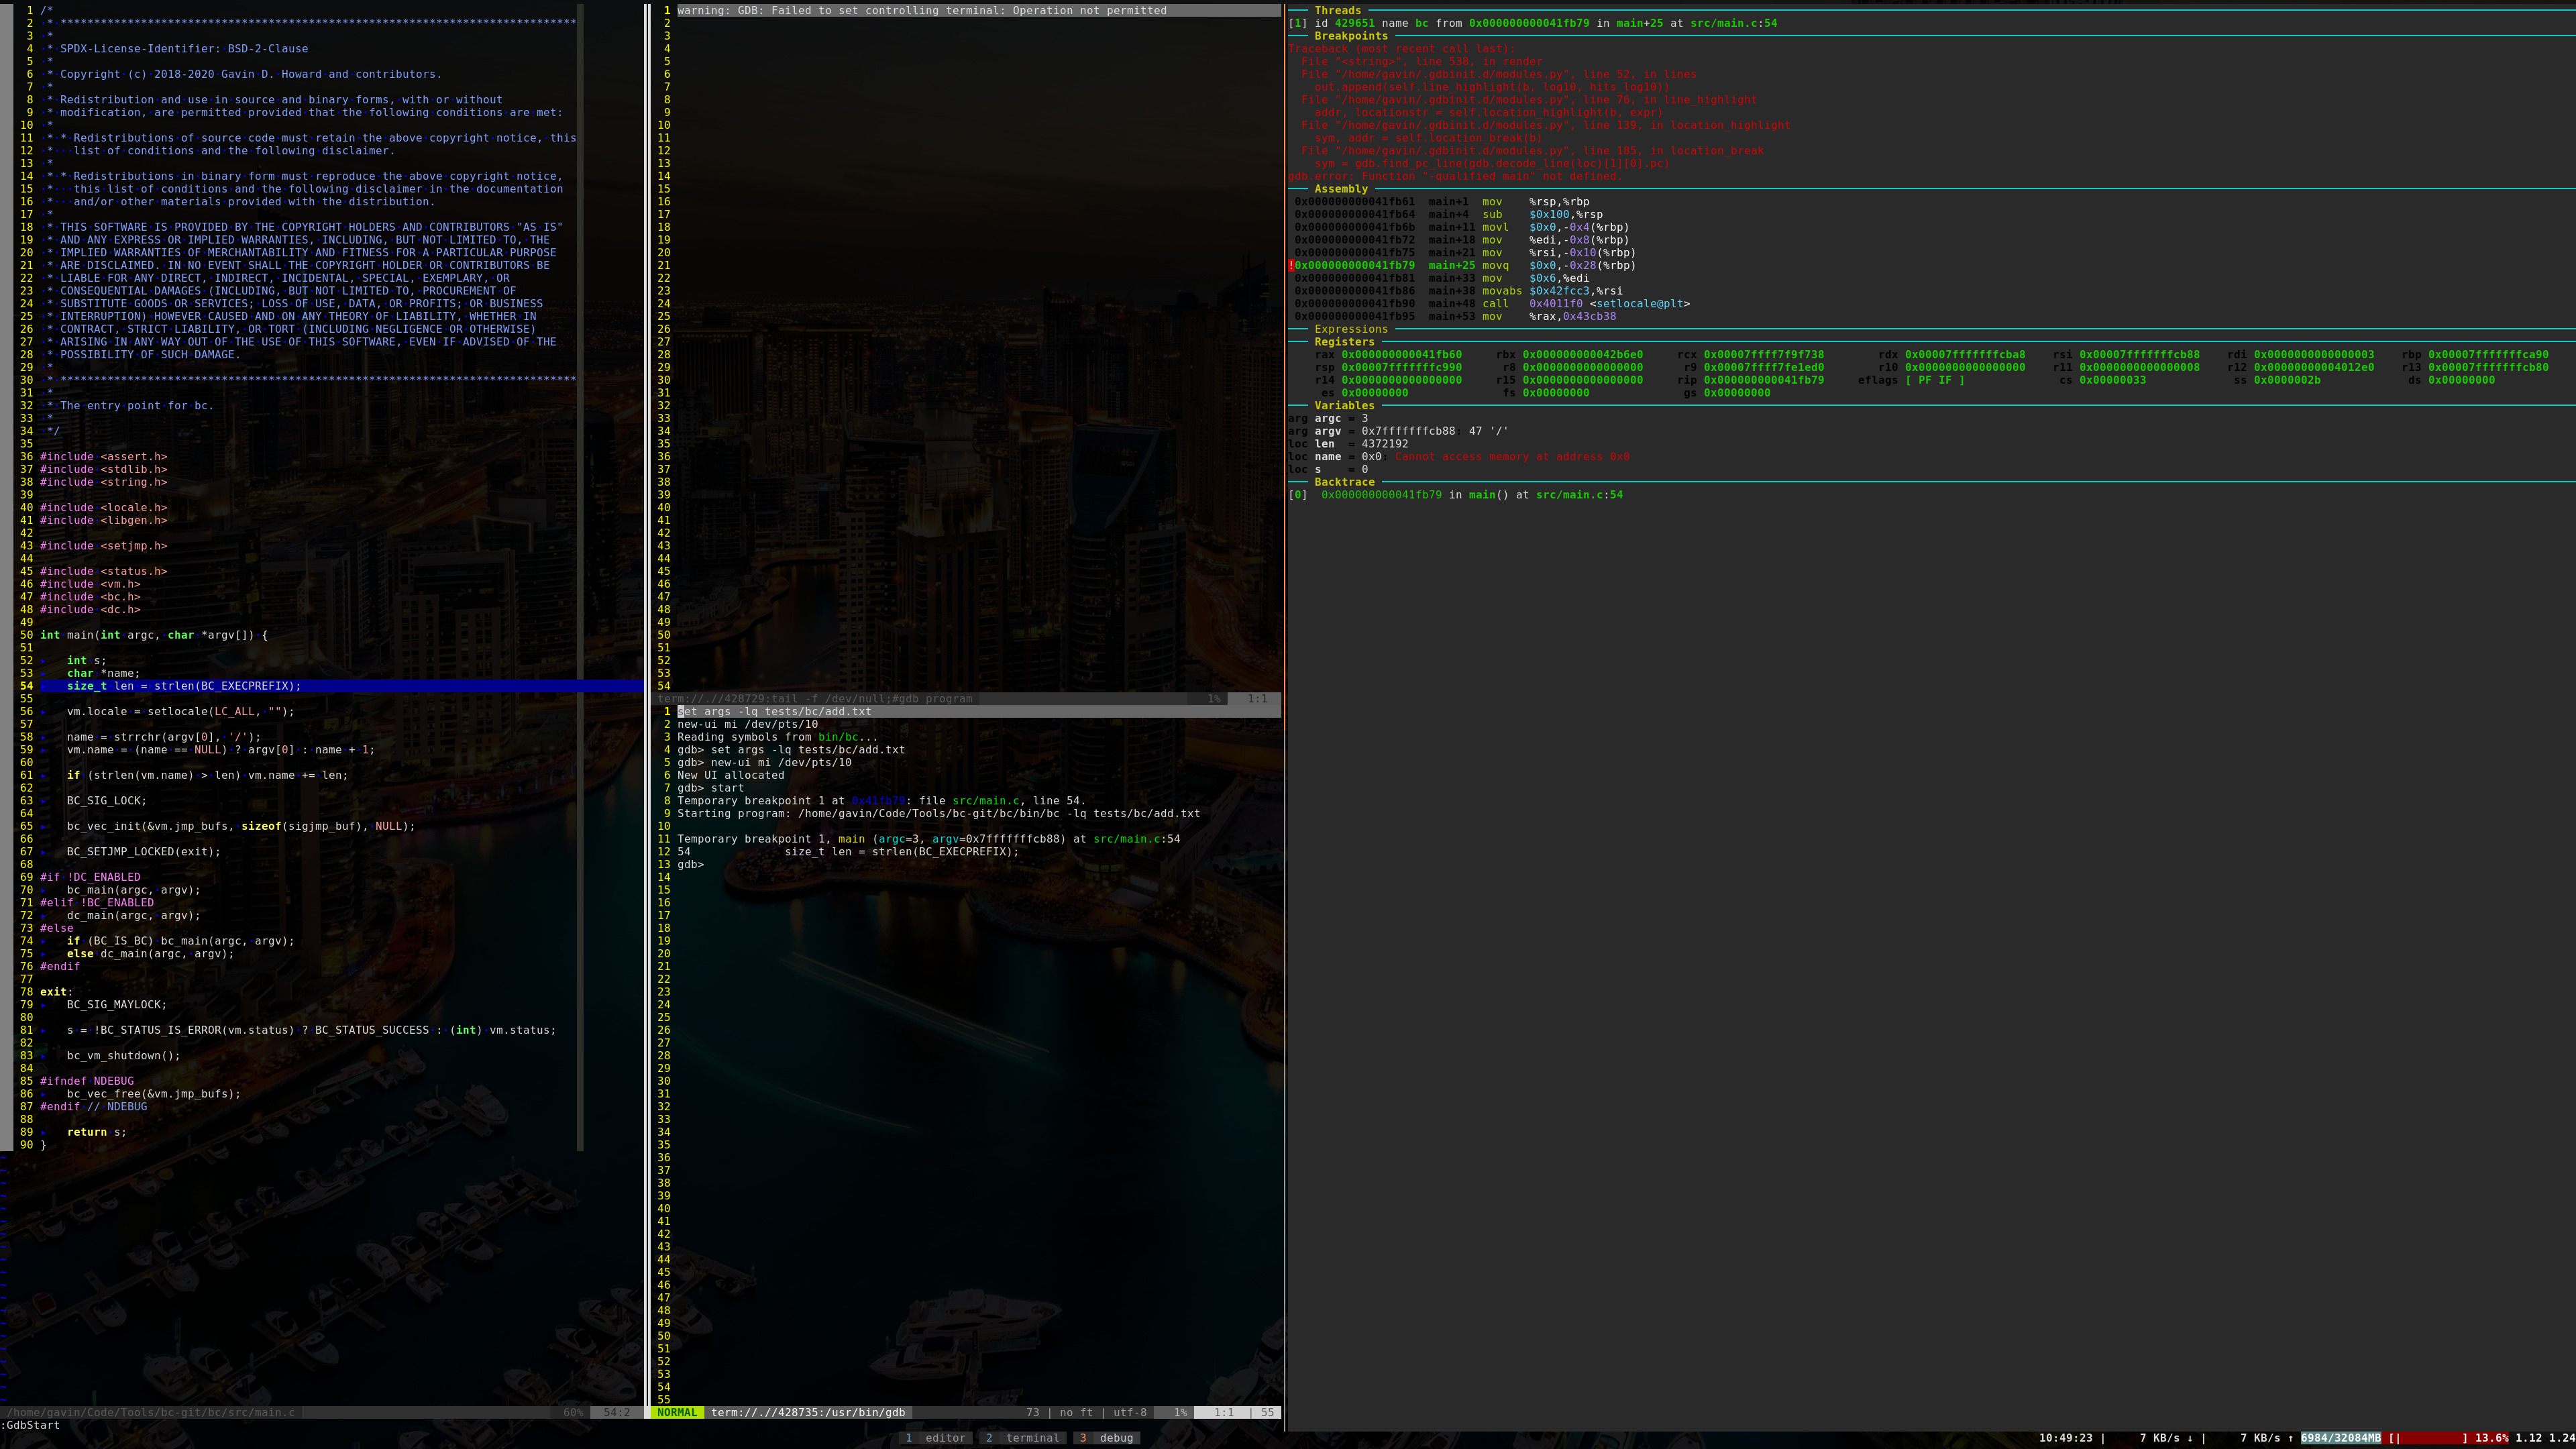
It would be at this point that I would load previous breakpoints with lb in
the gdb window or by pressing <F9>. In this case, however, I don’t have any
breakpoints to load, so I type i to get into insert mode, then b bc_num_as
to put a breakpoint at bc_num_as(), the function that does both addition
and subtraction.
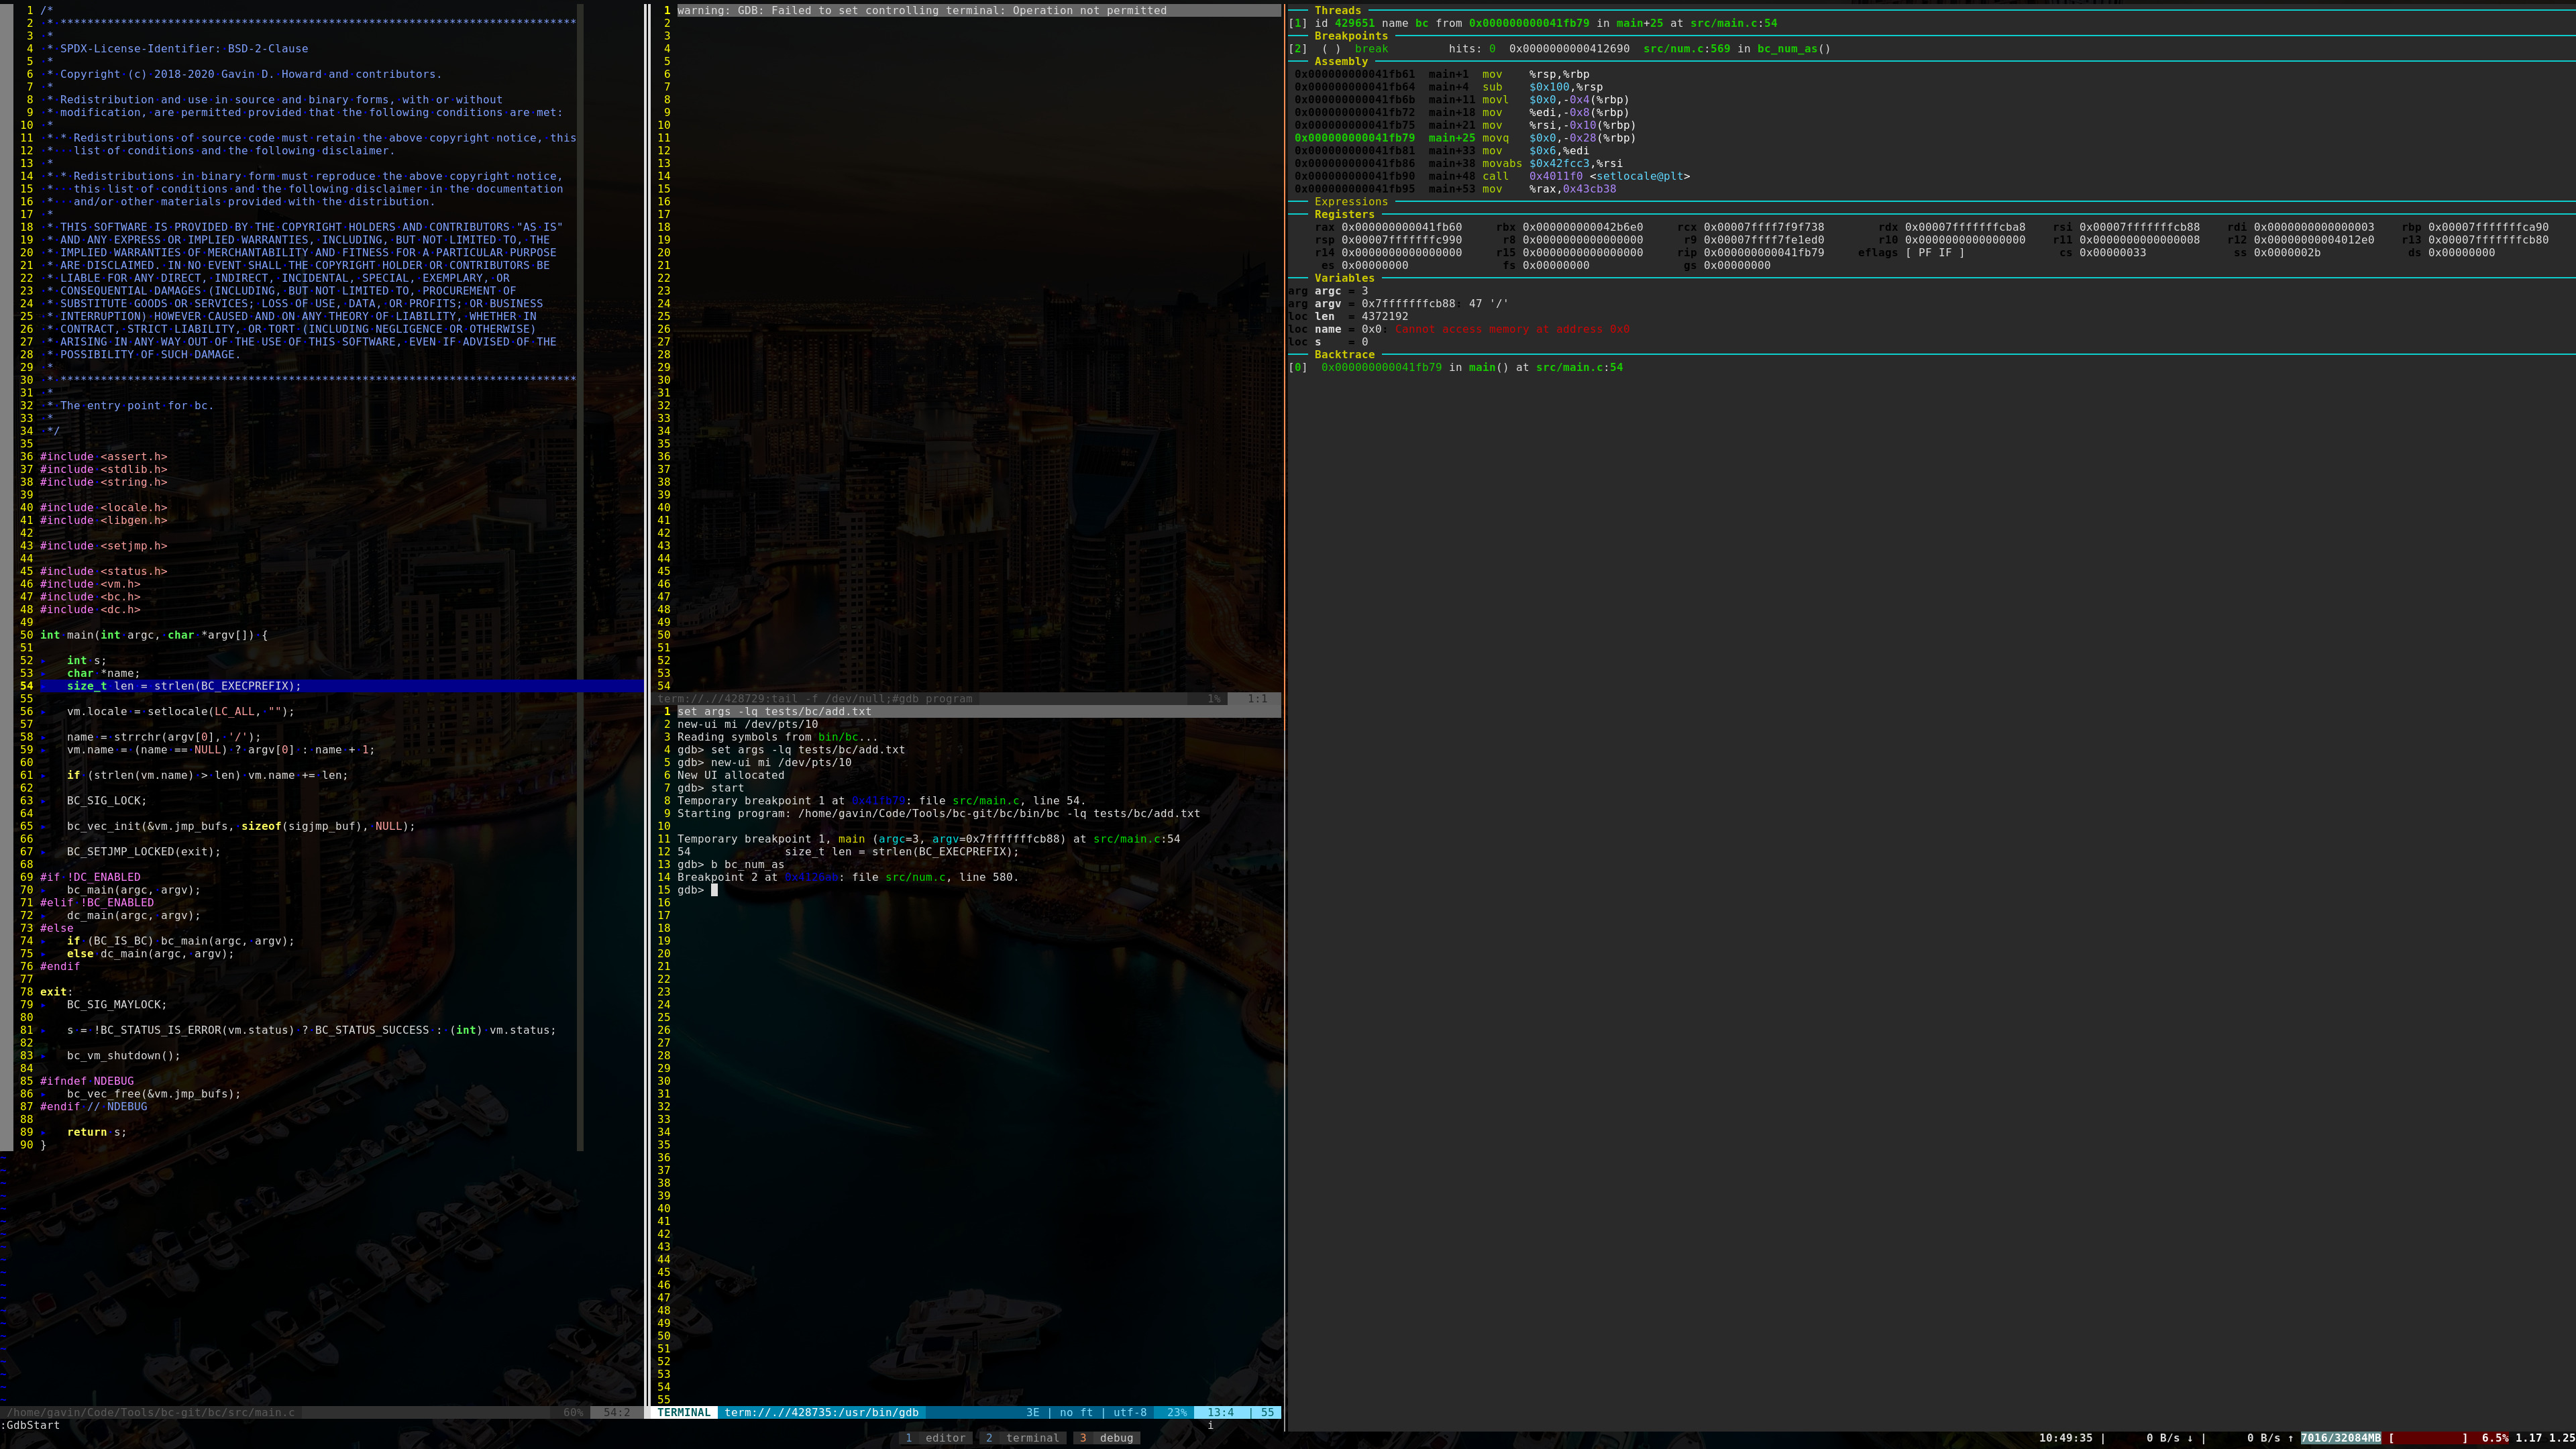
Then I hit <Esc><F3> to go to the breakpoint.
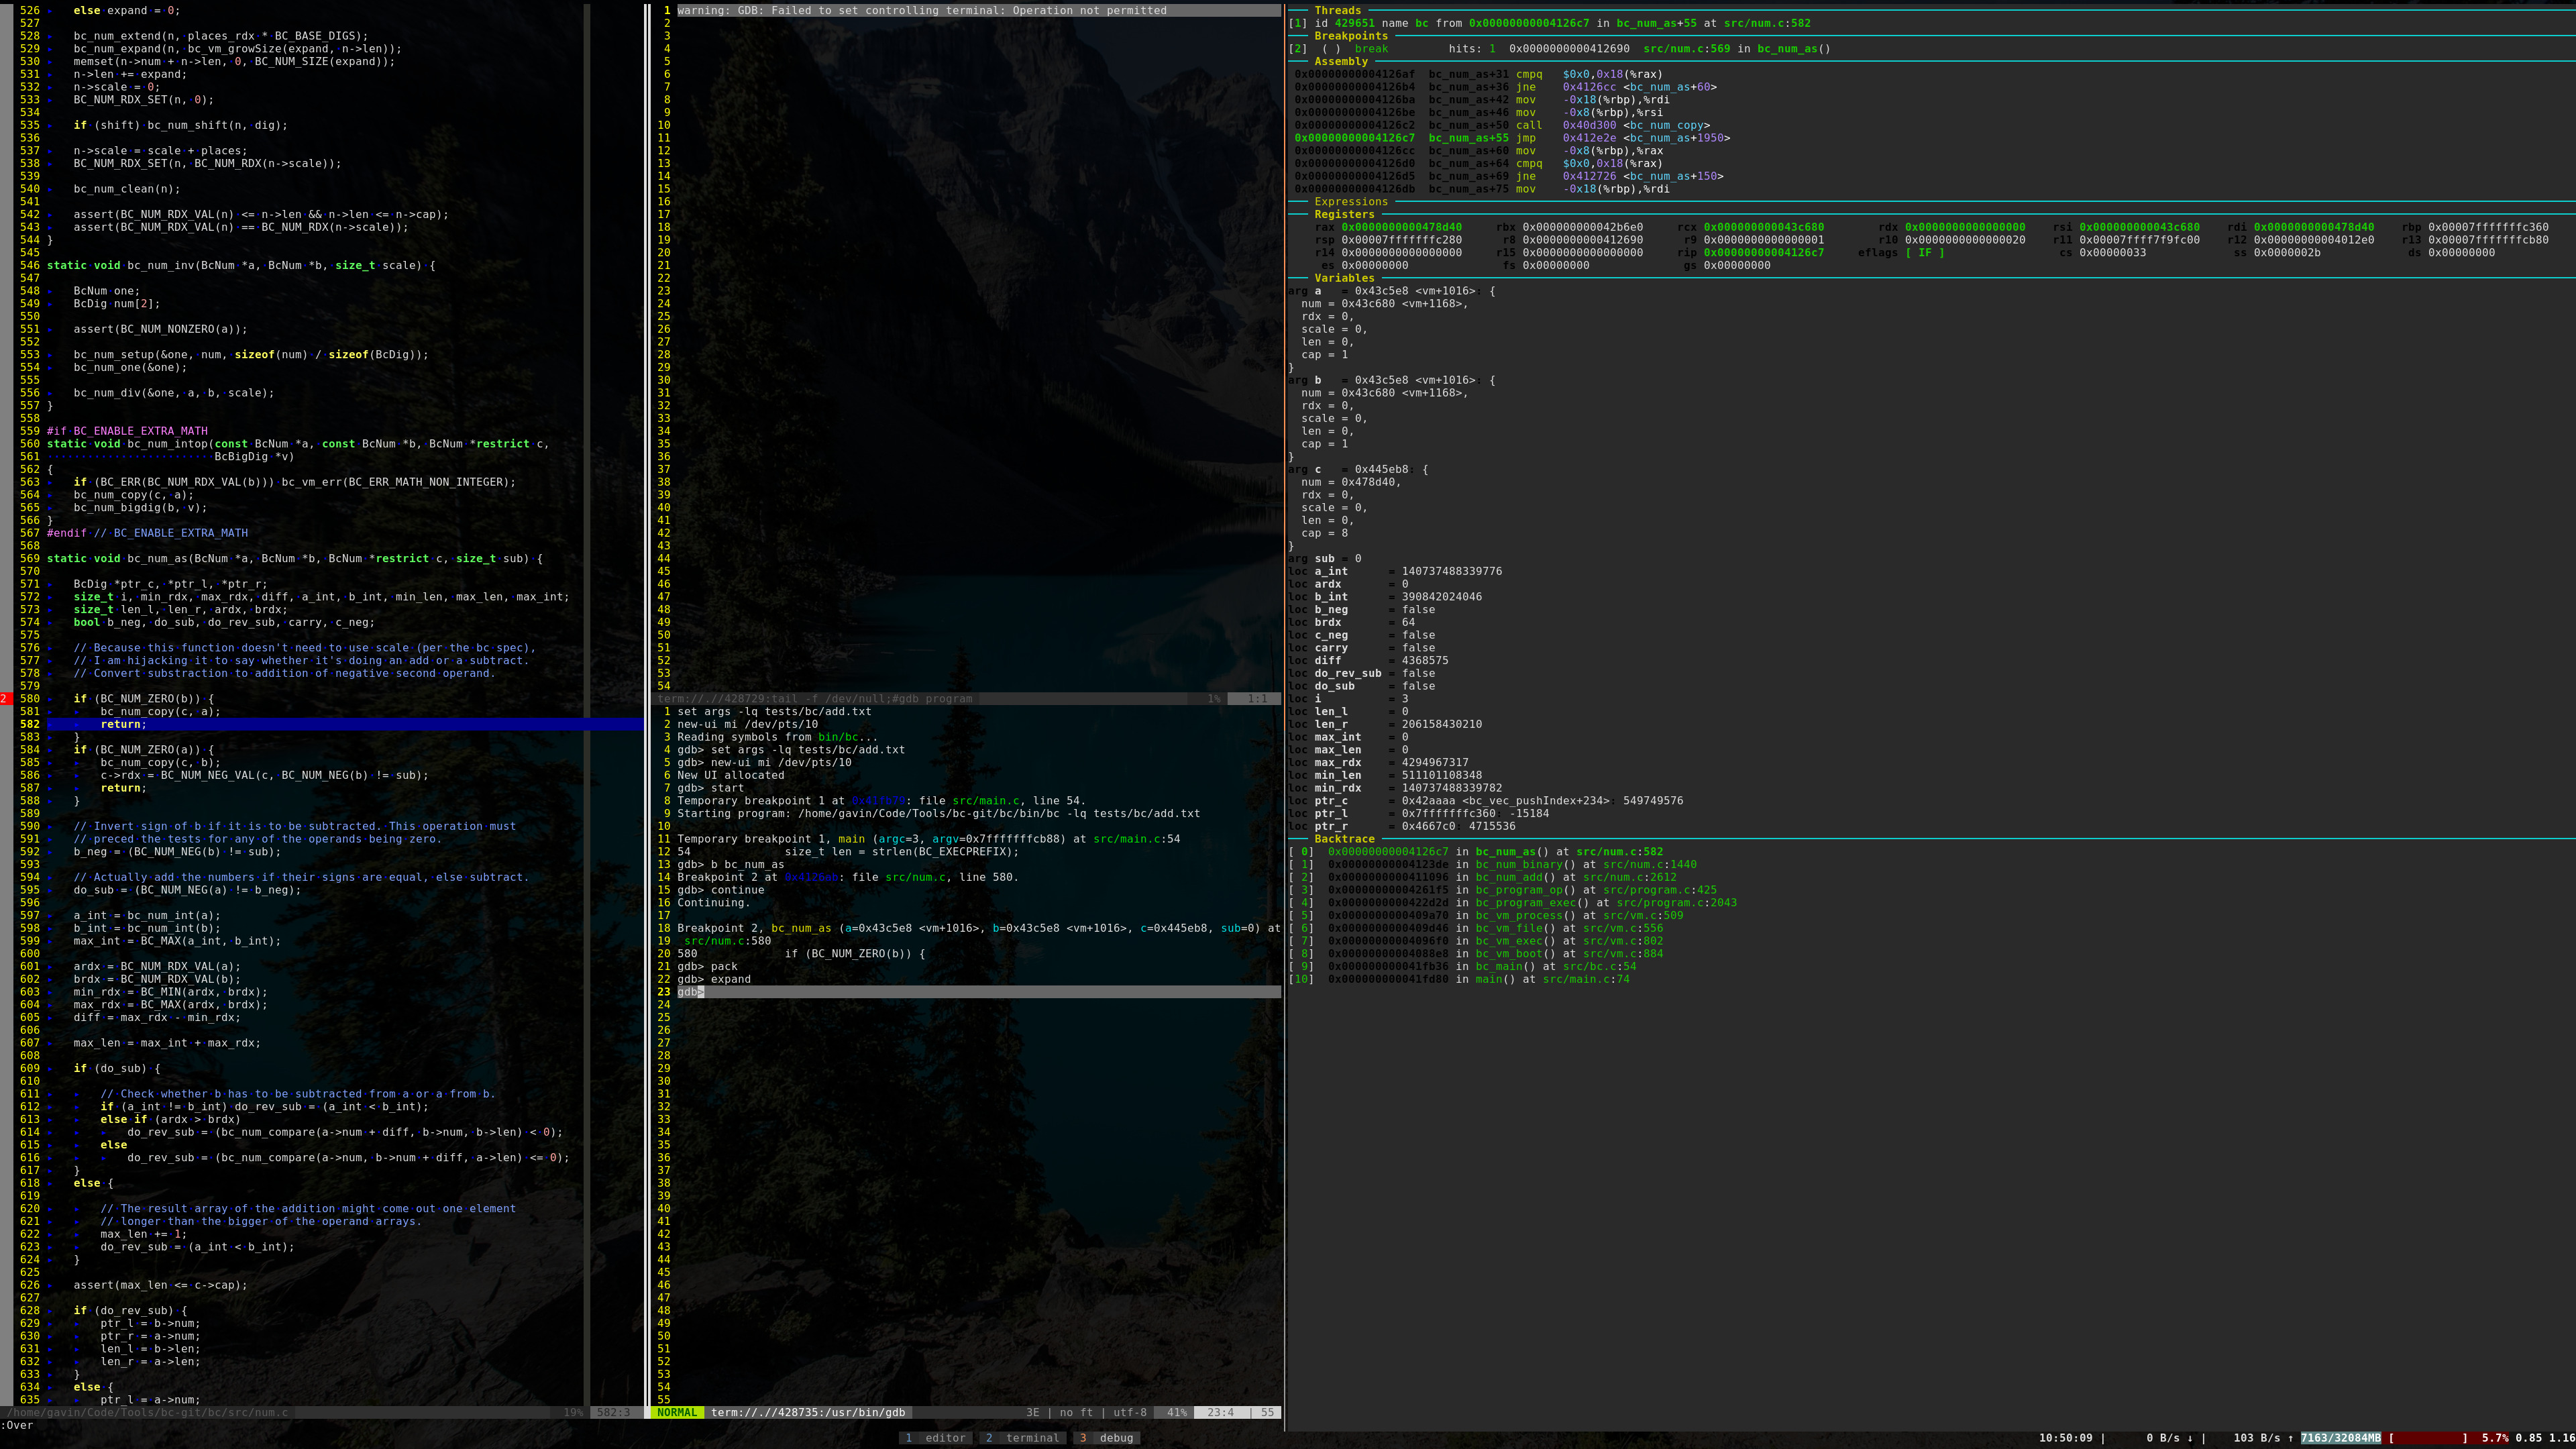
Then I can press <F4> to step to next line.

This one will skip function calls, but if I wanted to enter the called function,
I could use <F5>. And to finish a function, I can press <F6>.
Then I step again.
If I want to see where I am in the source across the call stack, I can press
<F7> to go up the stack.
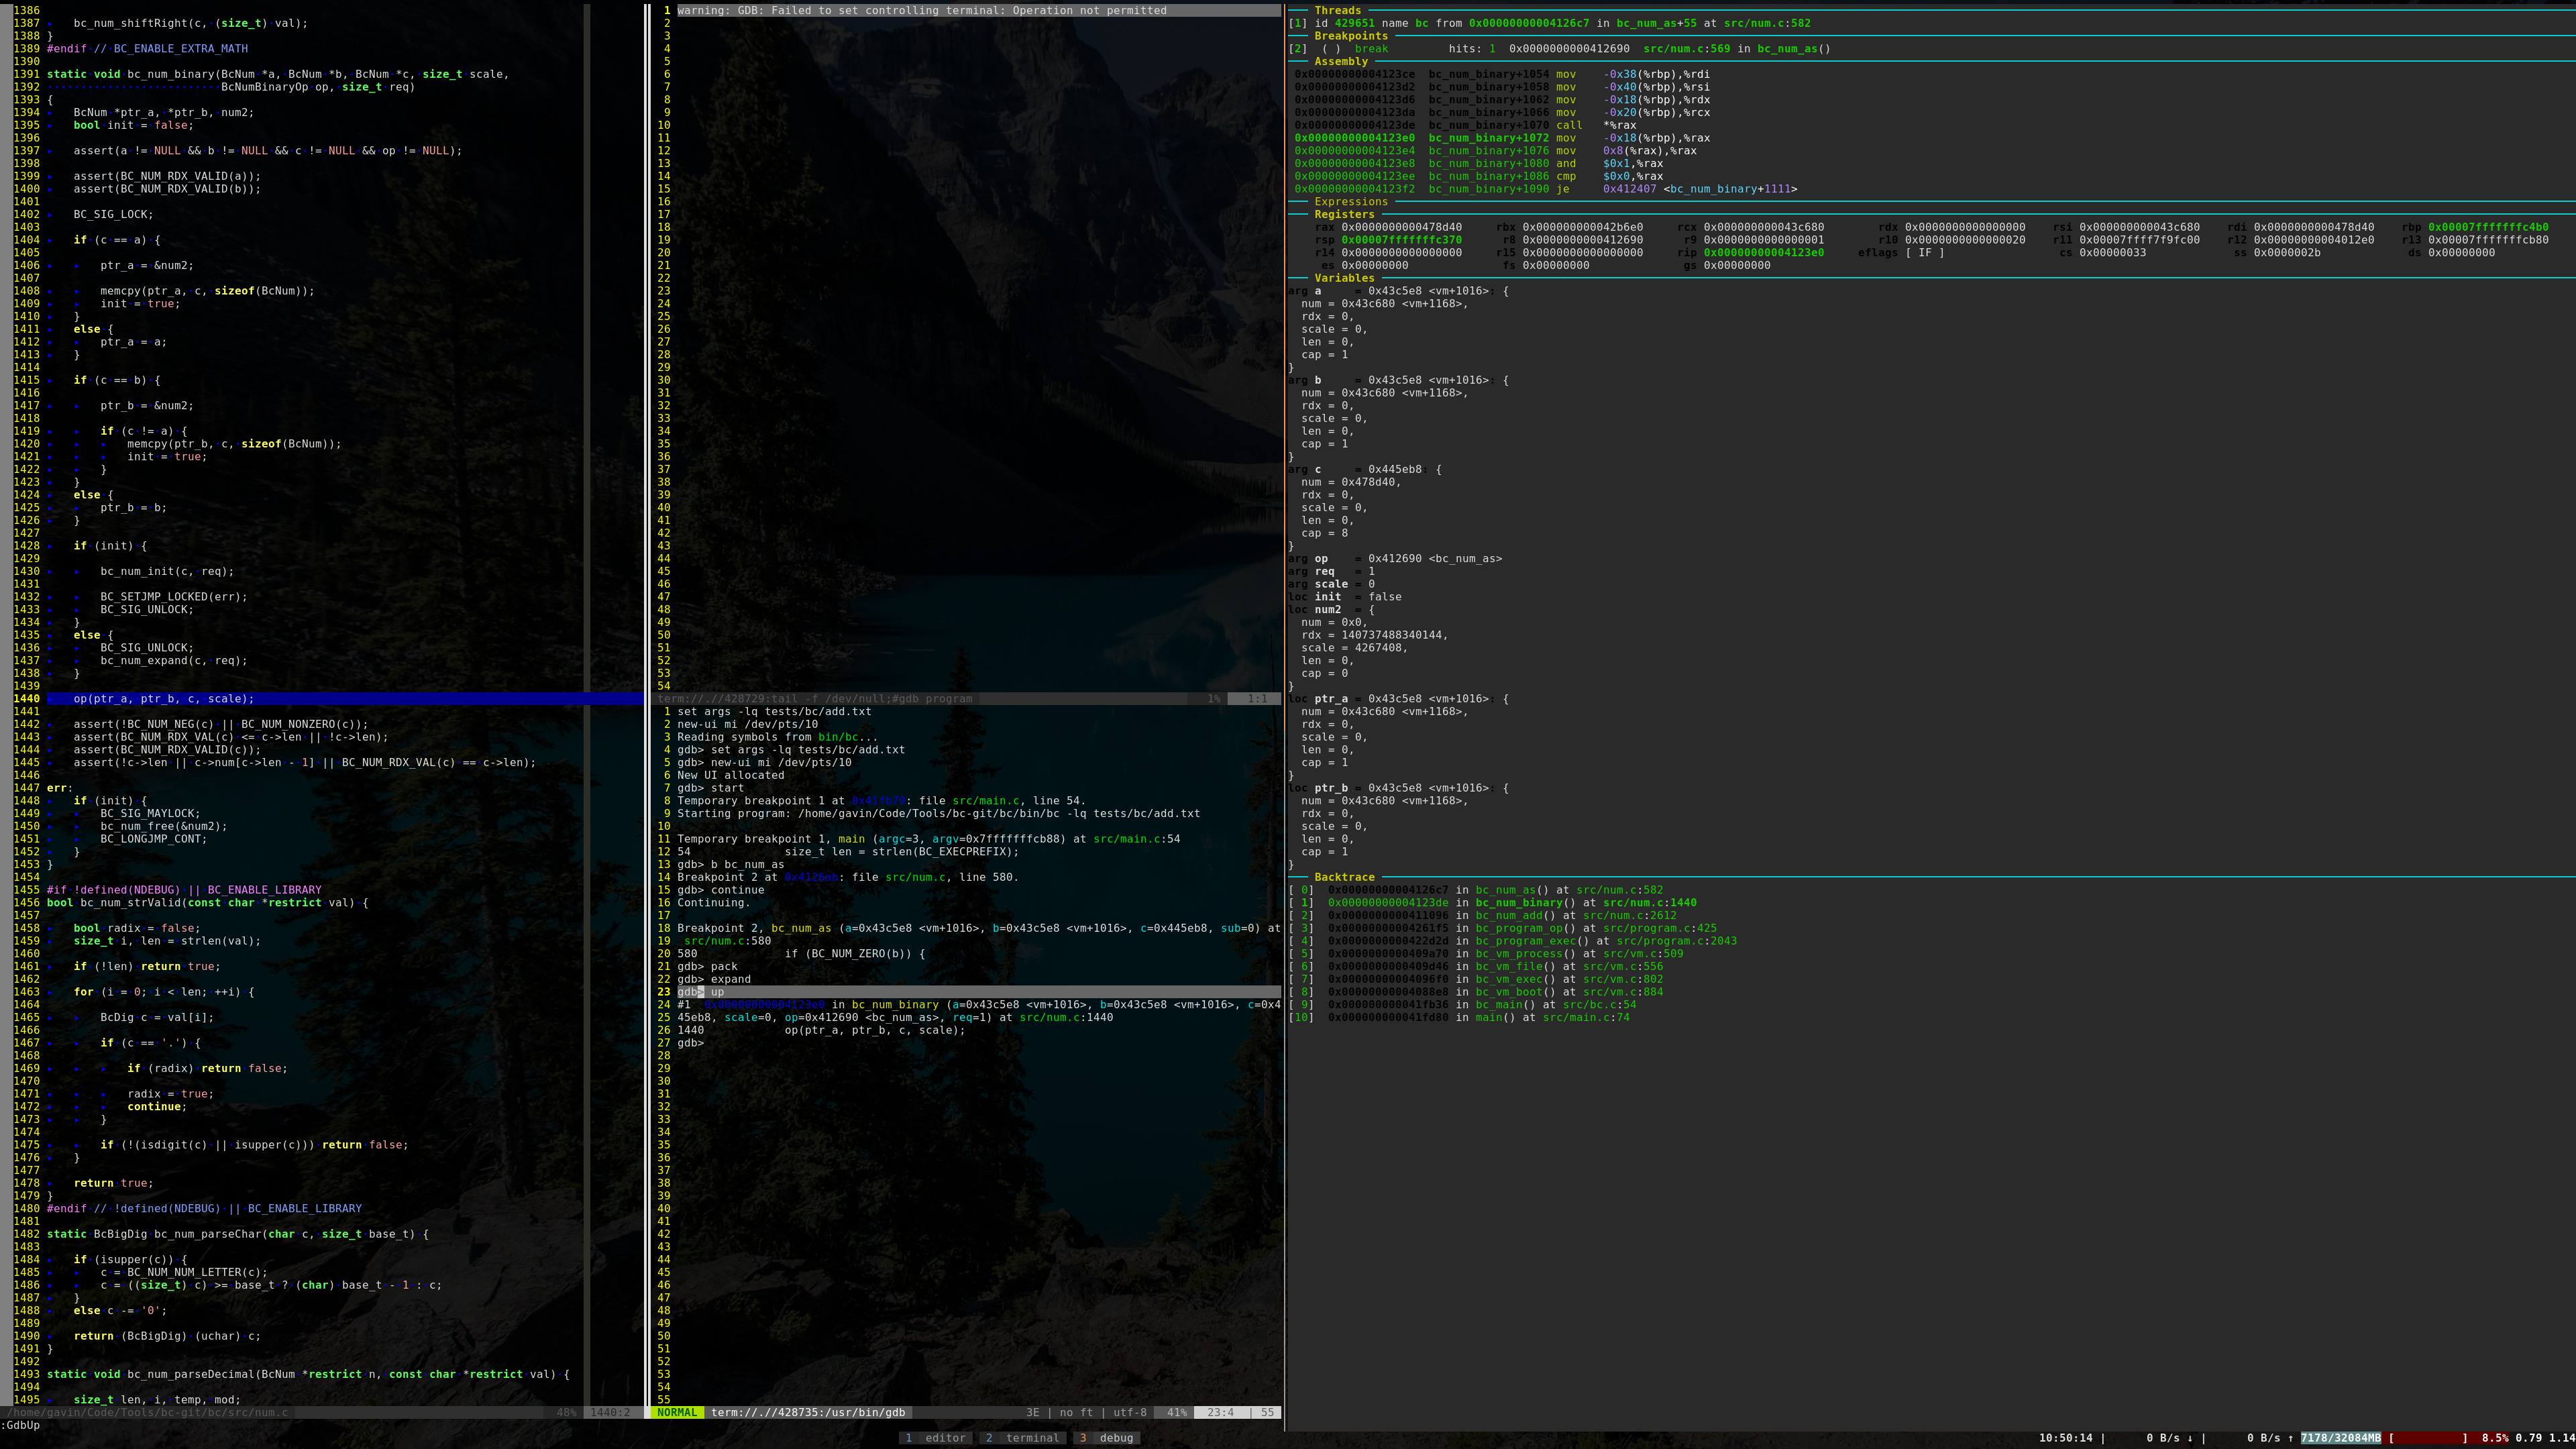
After looking around, I go back down with <F8>.
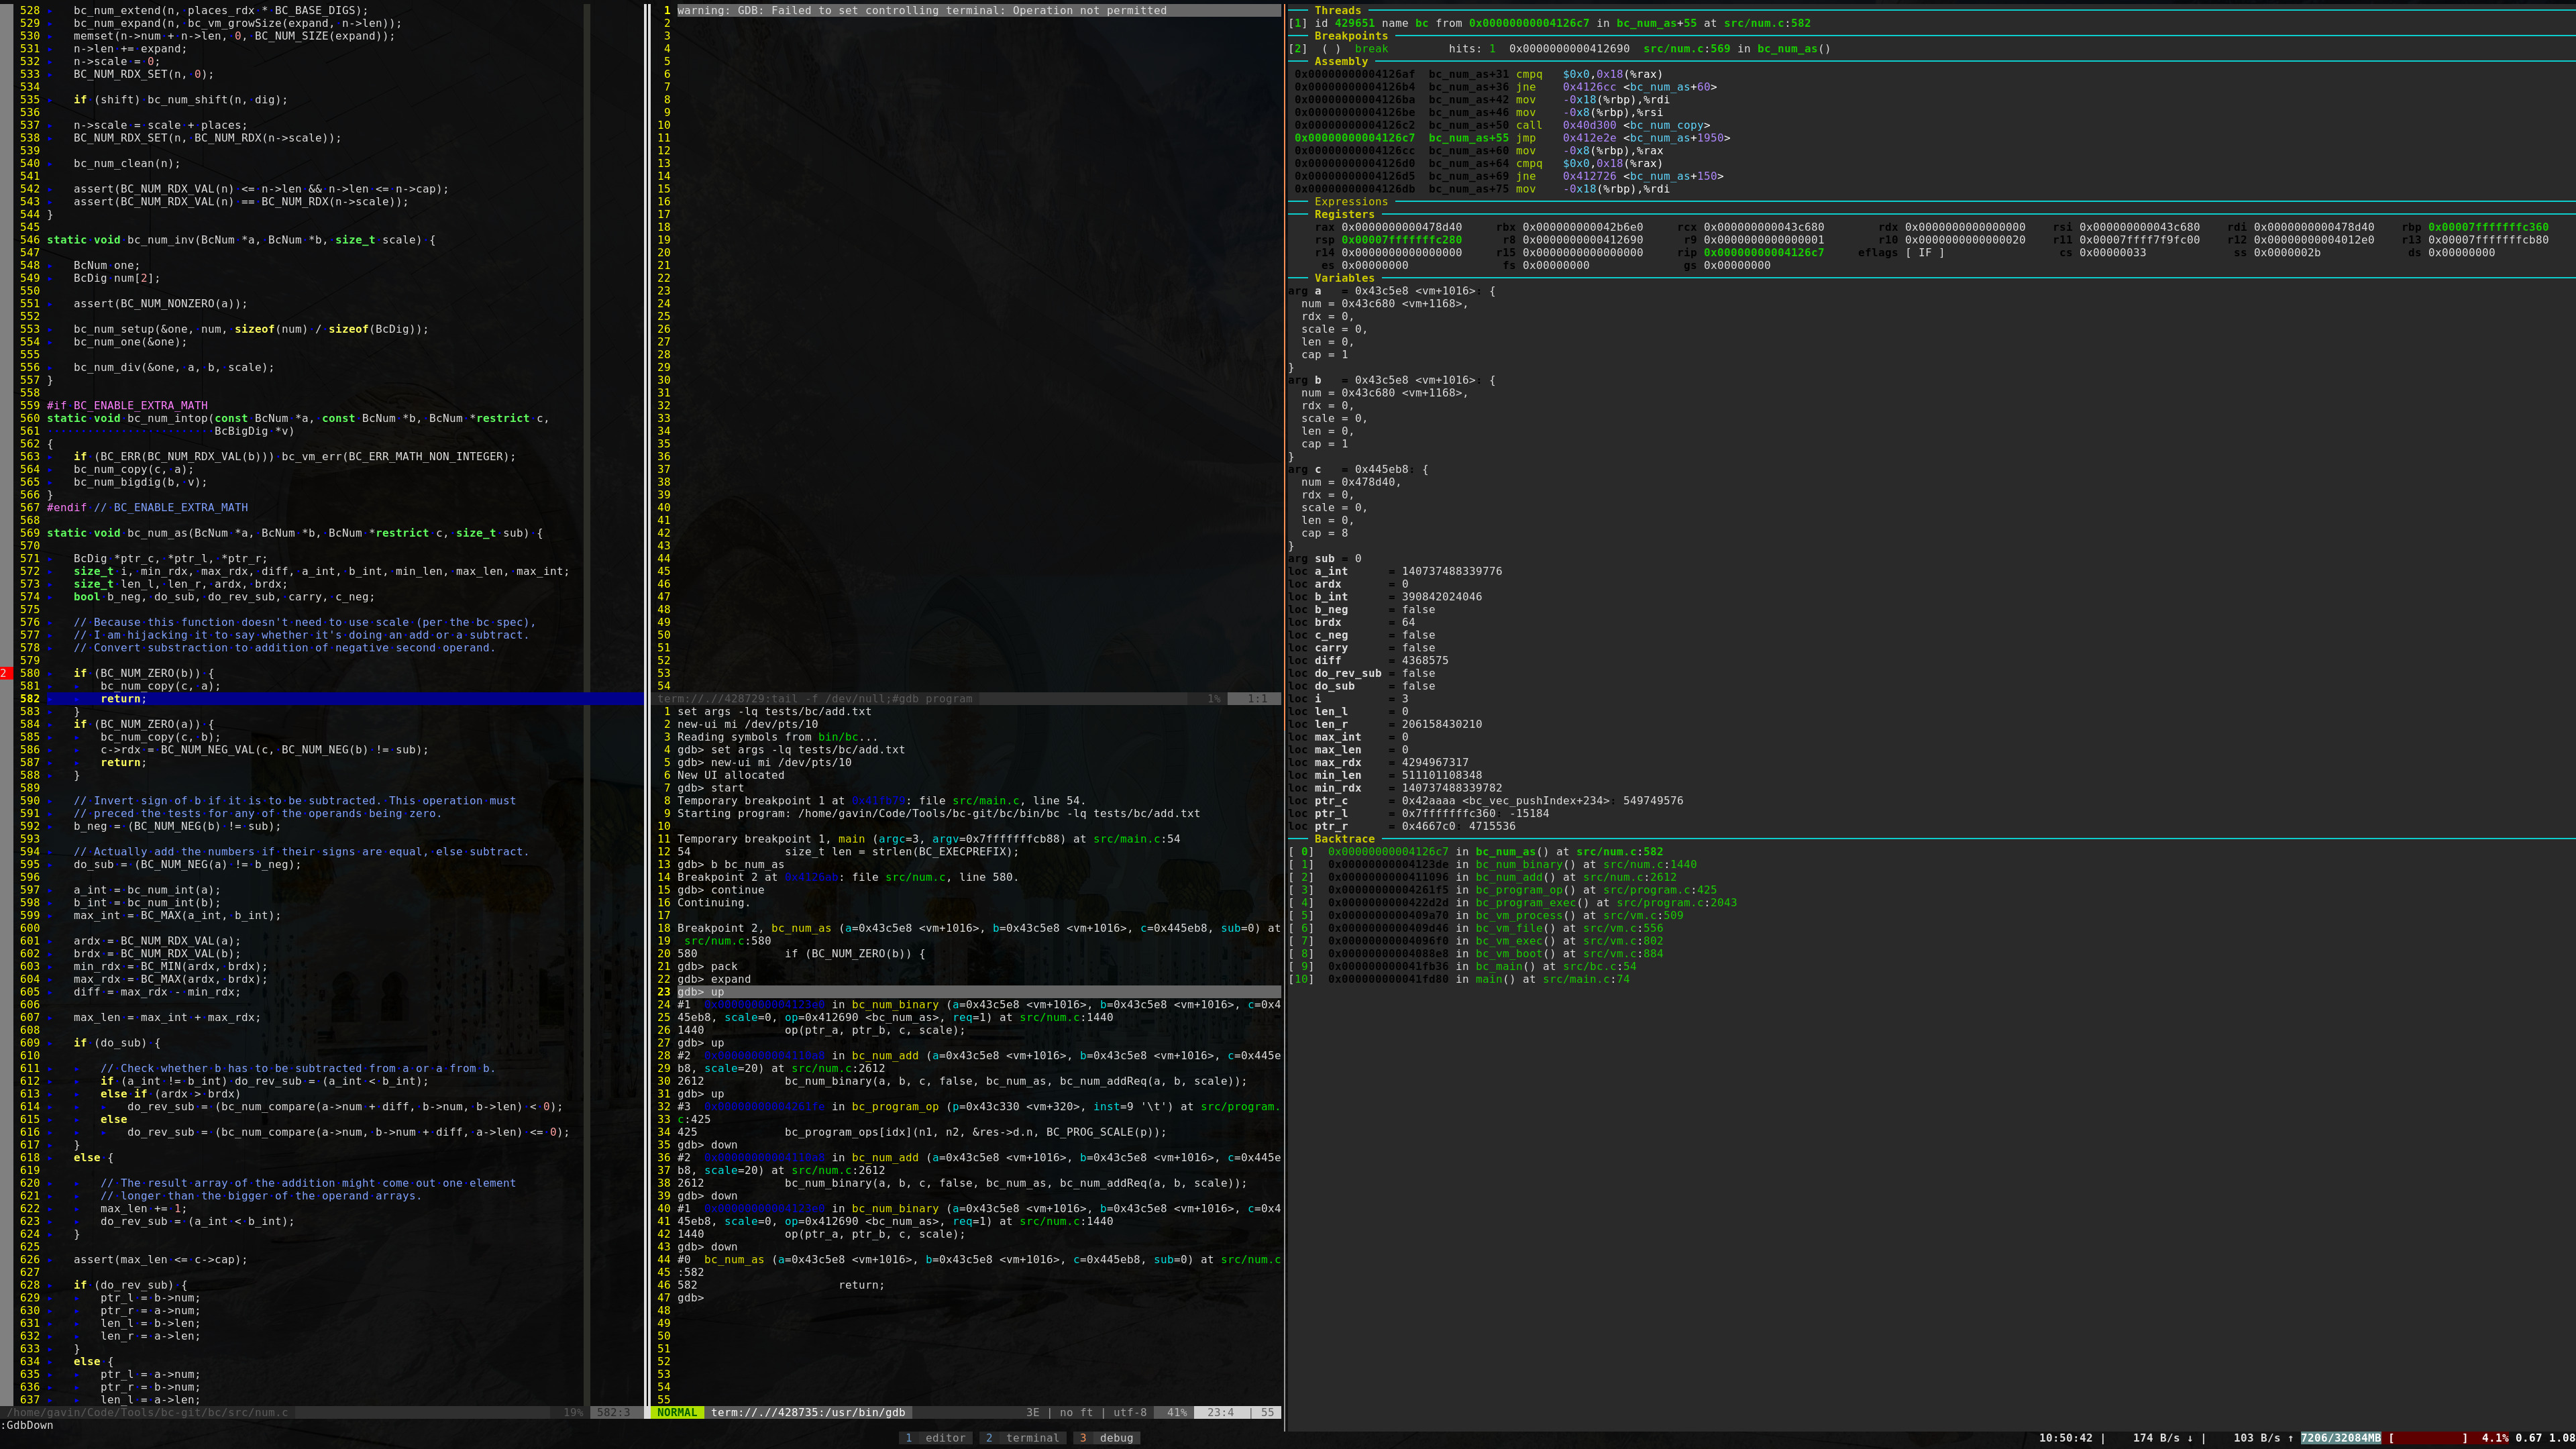
Please ignore the extra output in the gdb window; I actually went up a few
more times when creating these screenshots.
If I think the variables are going to take up to much space, I can go into
insert mode and type pack.

If I want to go back, I can type expand.
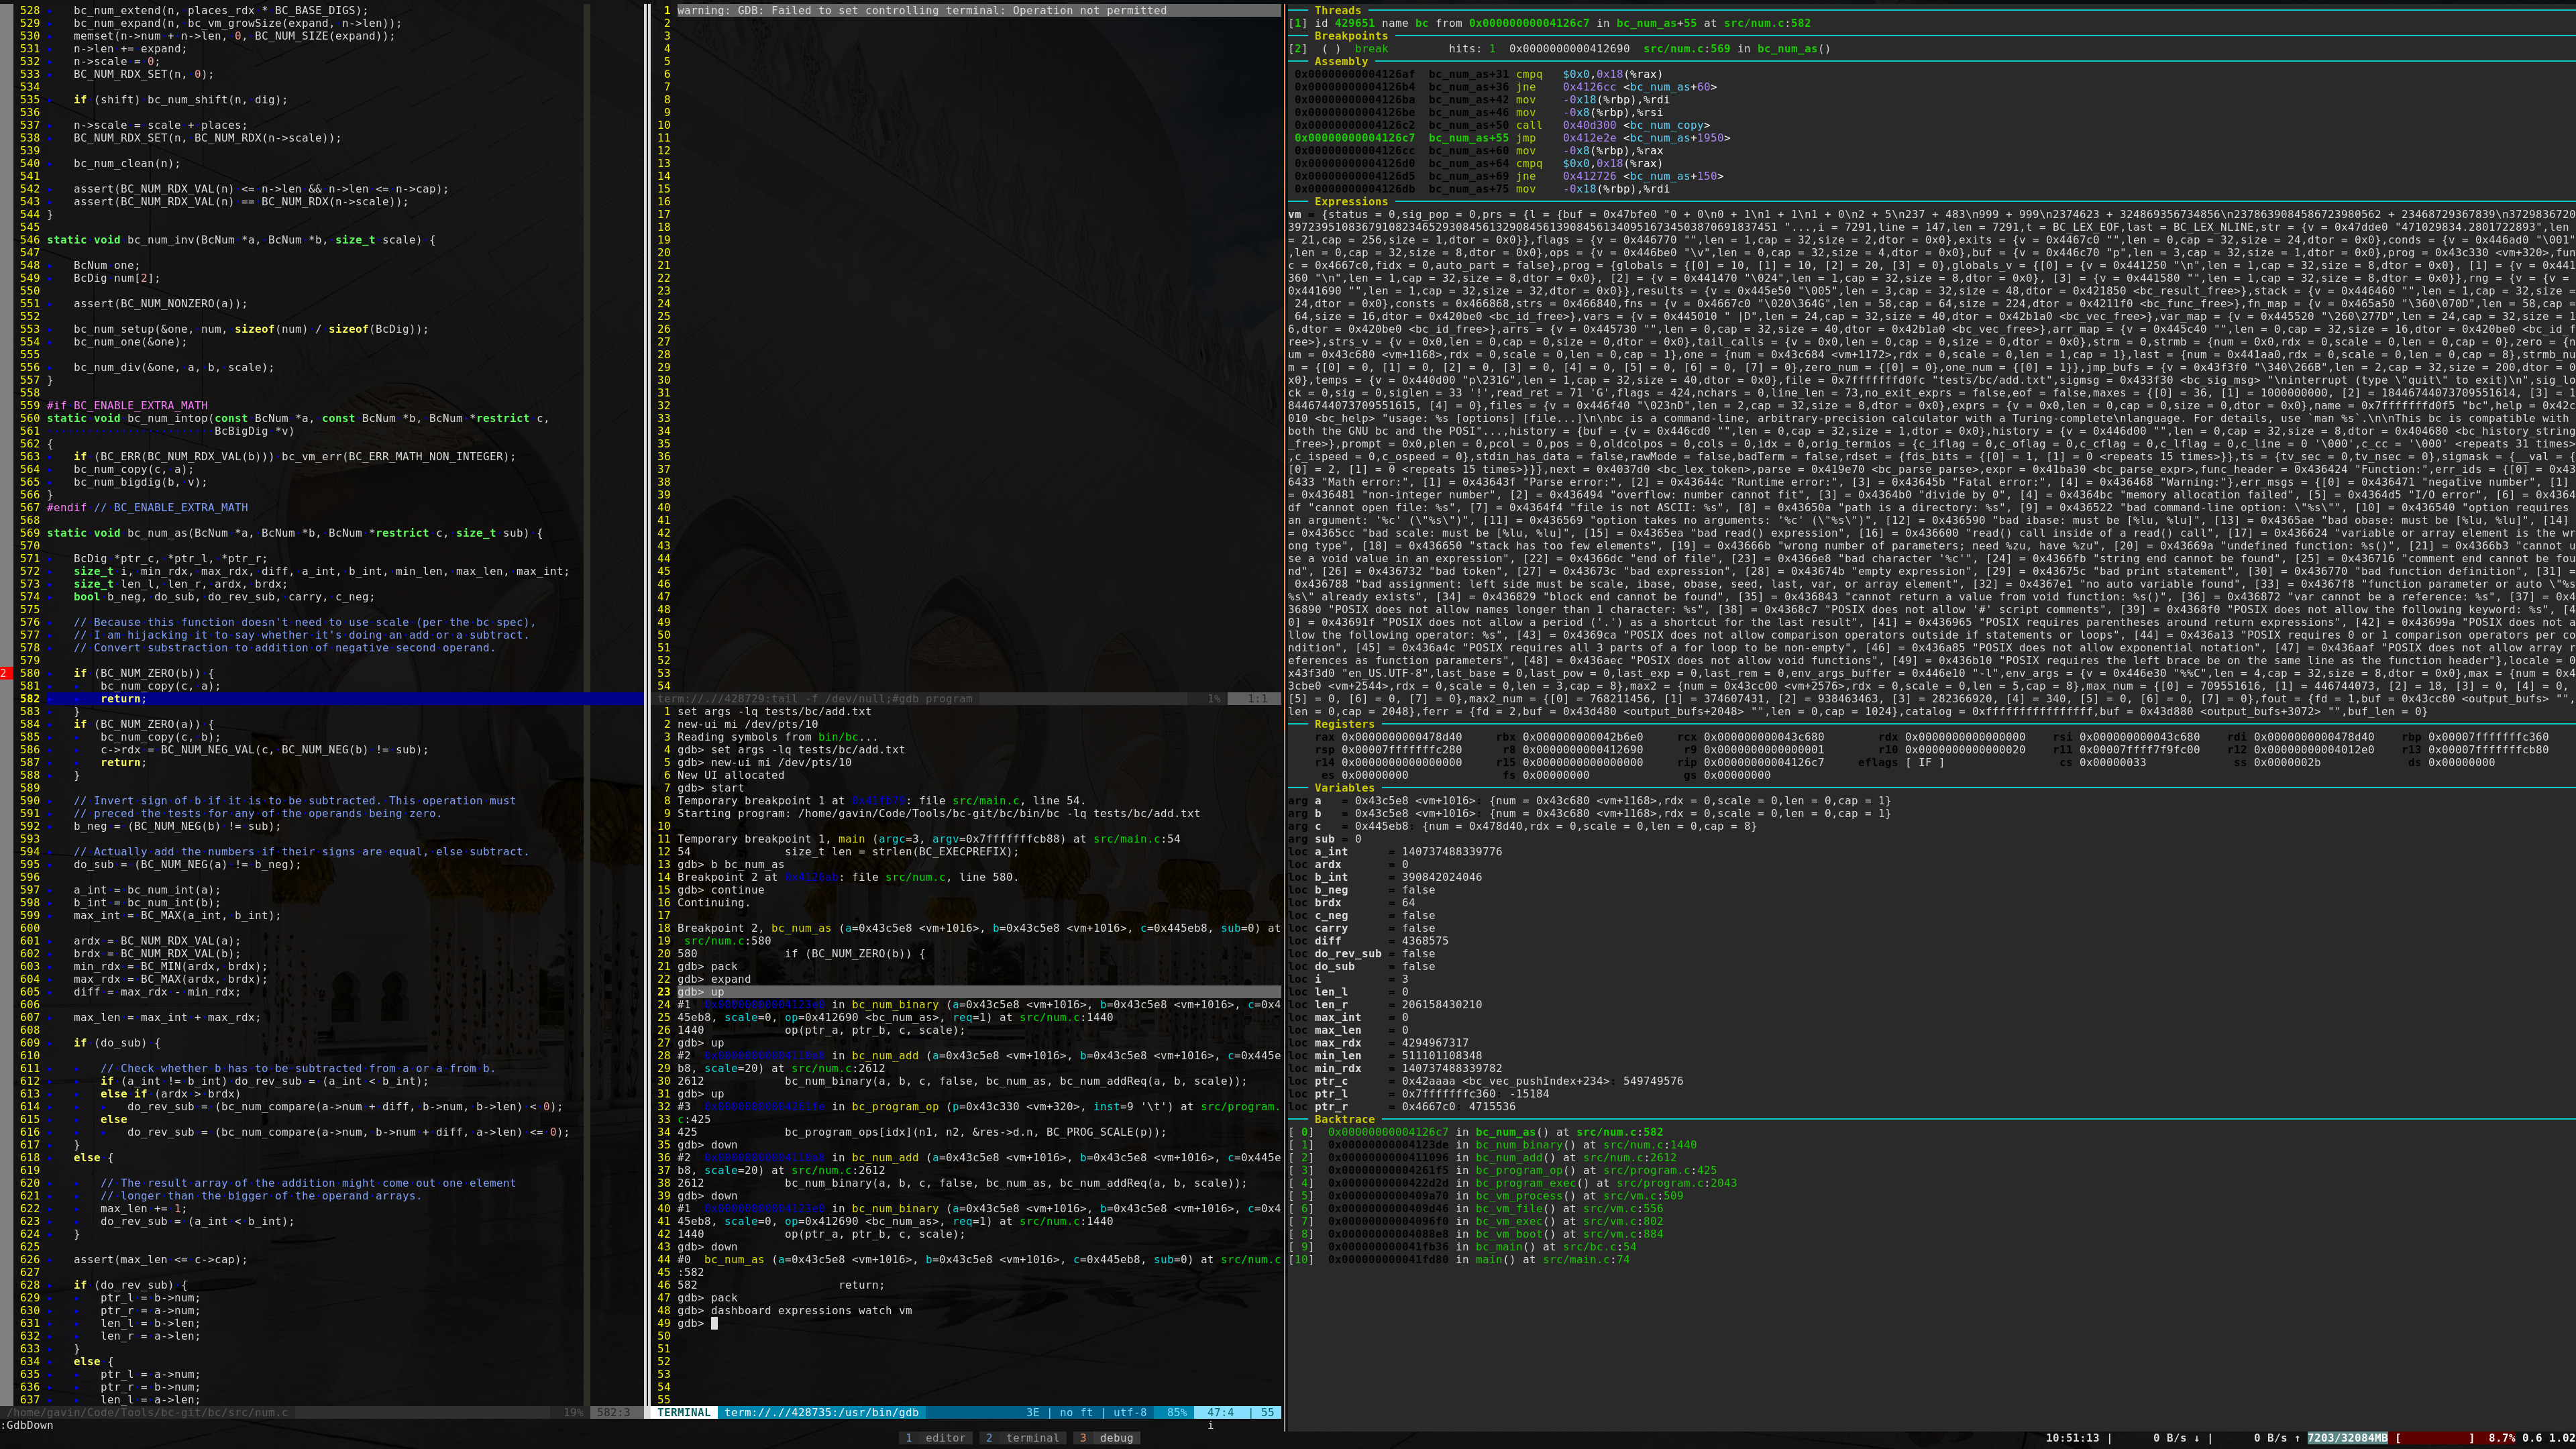
I have a problem: I have a global variable that I want to see. gdb-dashboard
lets me do that. I type dashboard expressions watch <variable_name>. In this
case, it’s called vm:
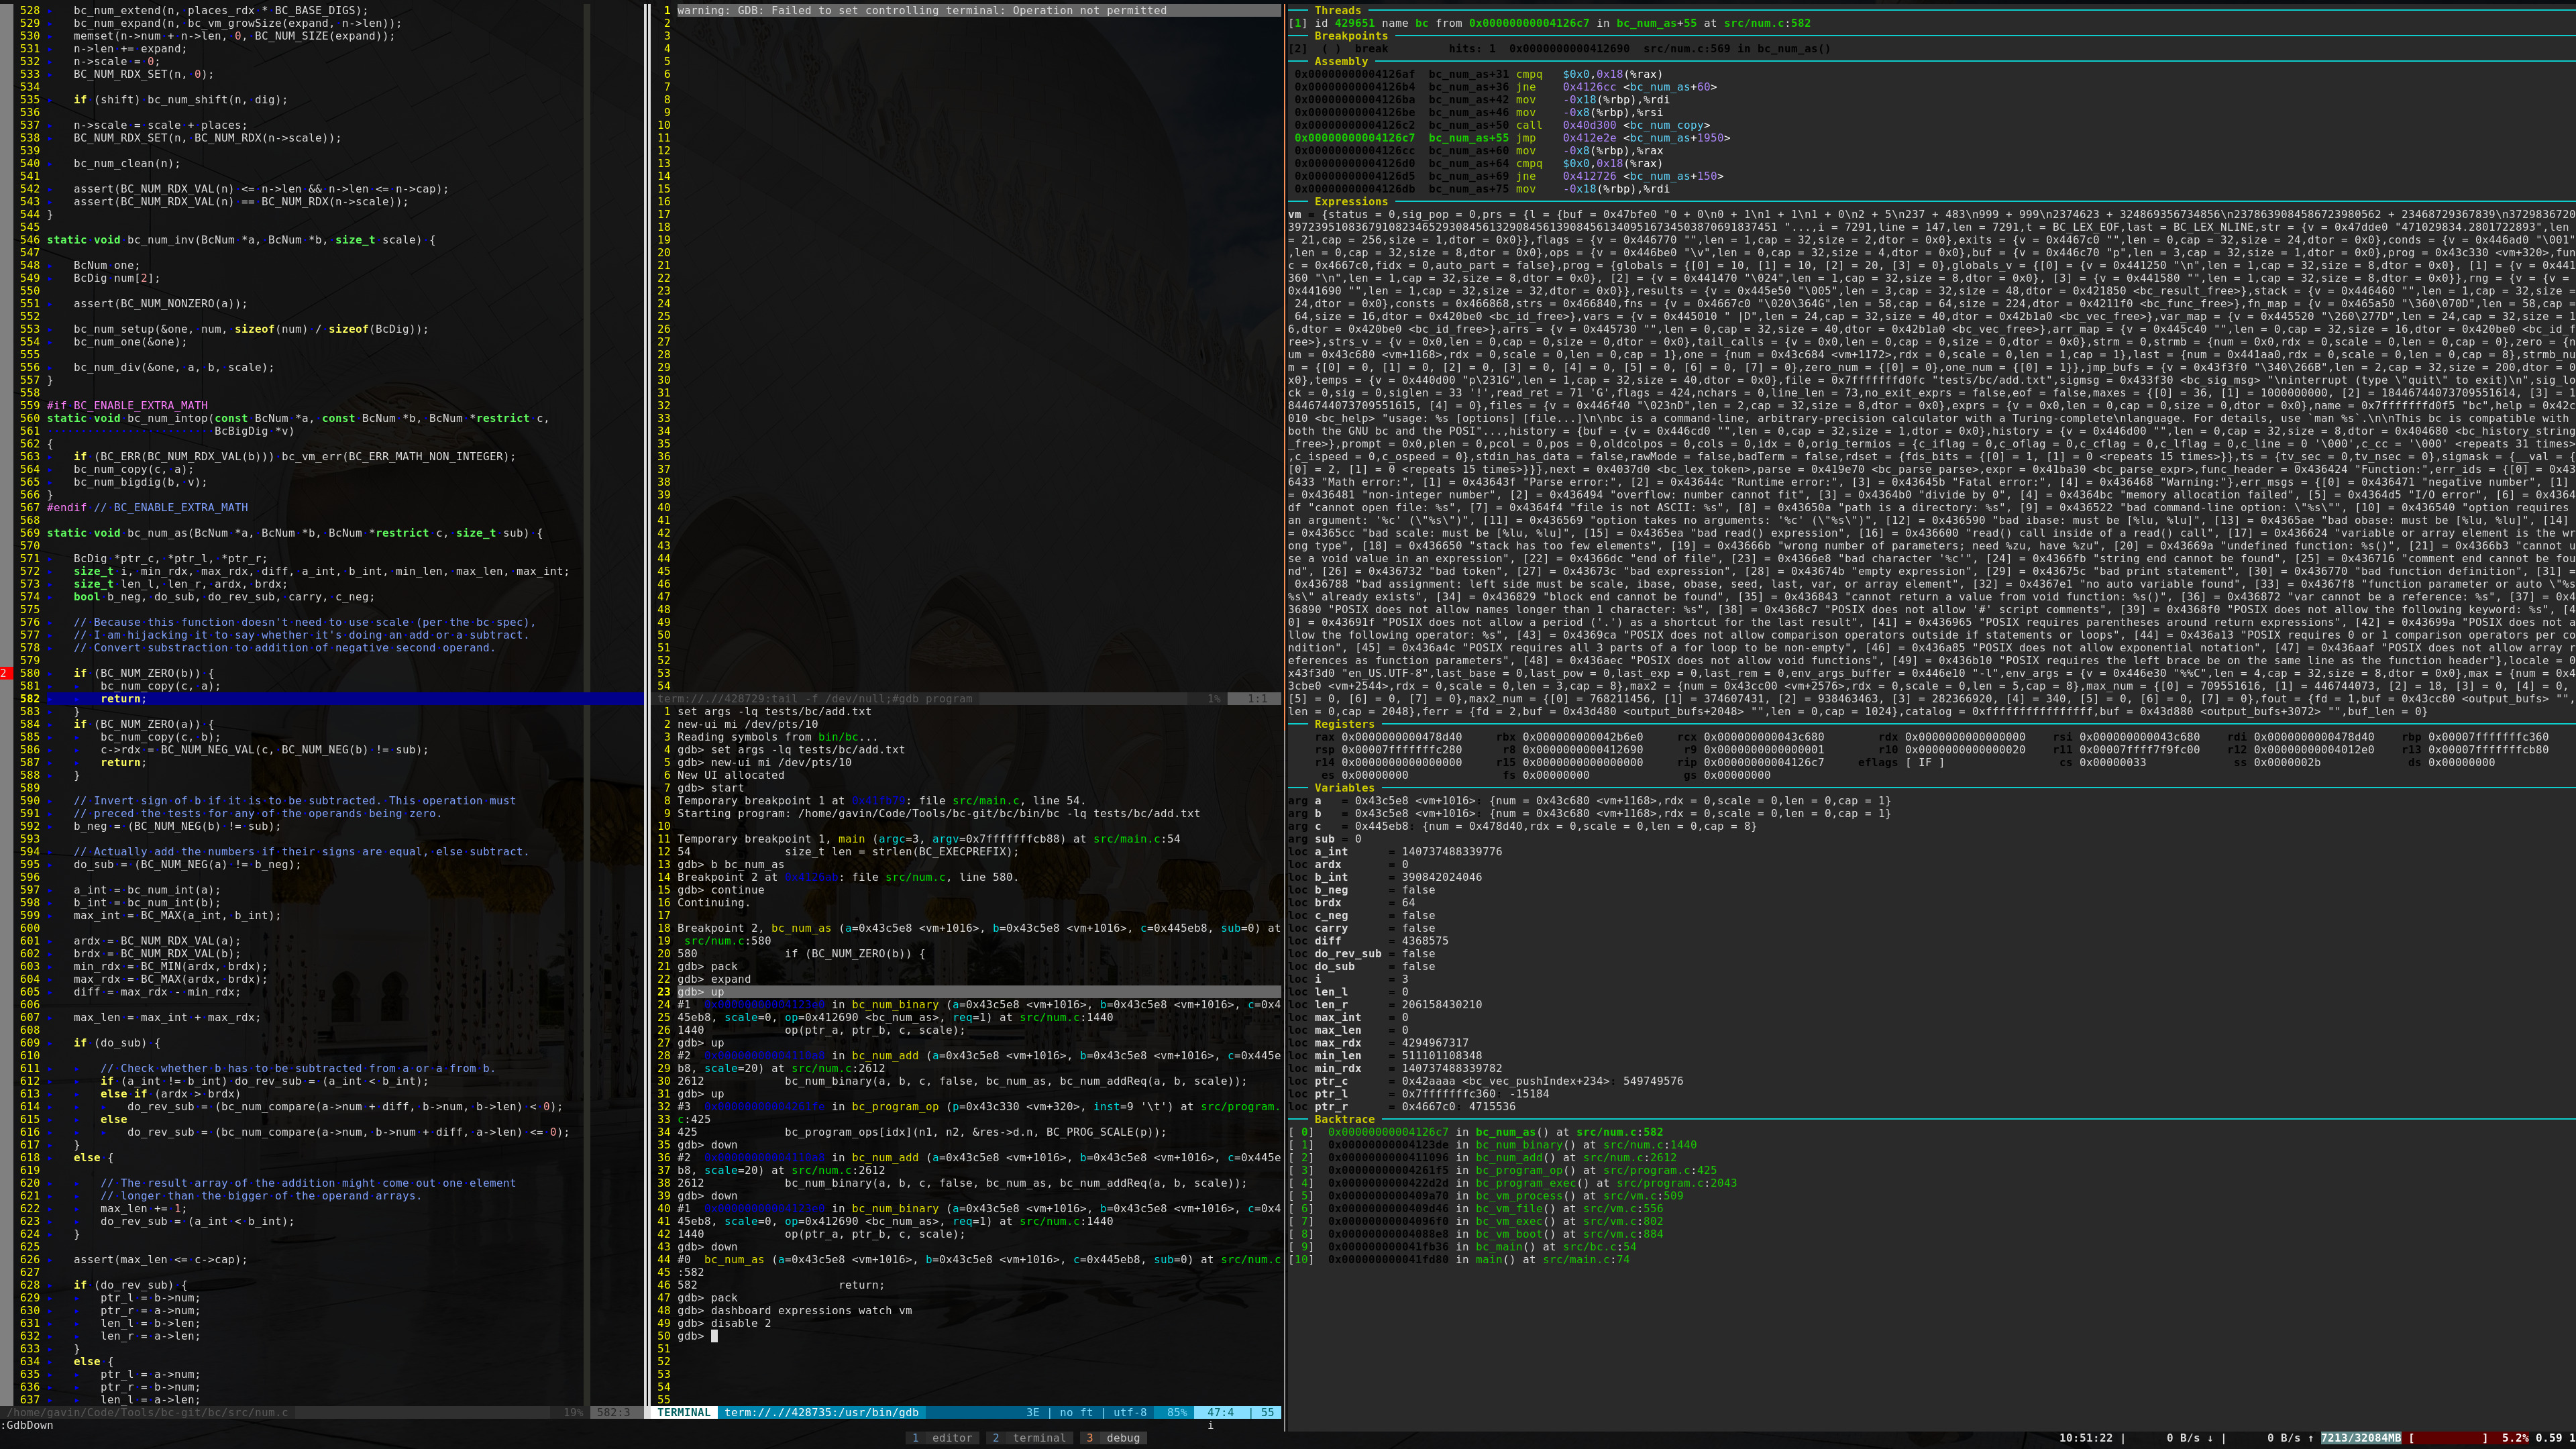
Then I disable the breakpoint using its number.
Then I hit <Esc><F3> to continue again.
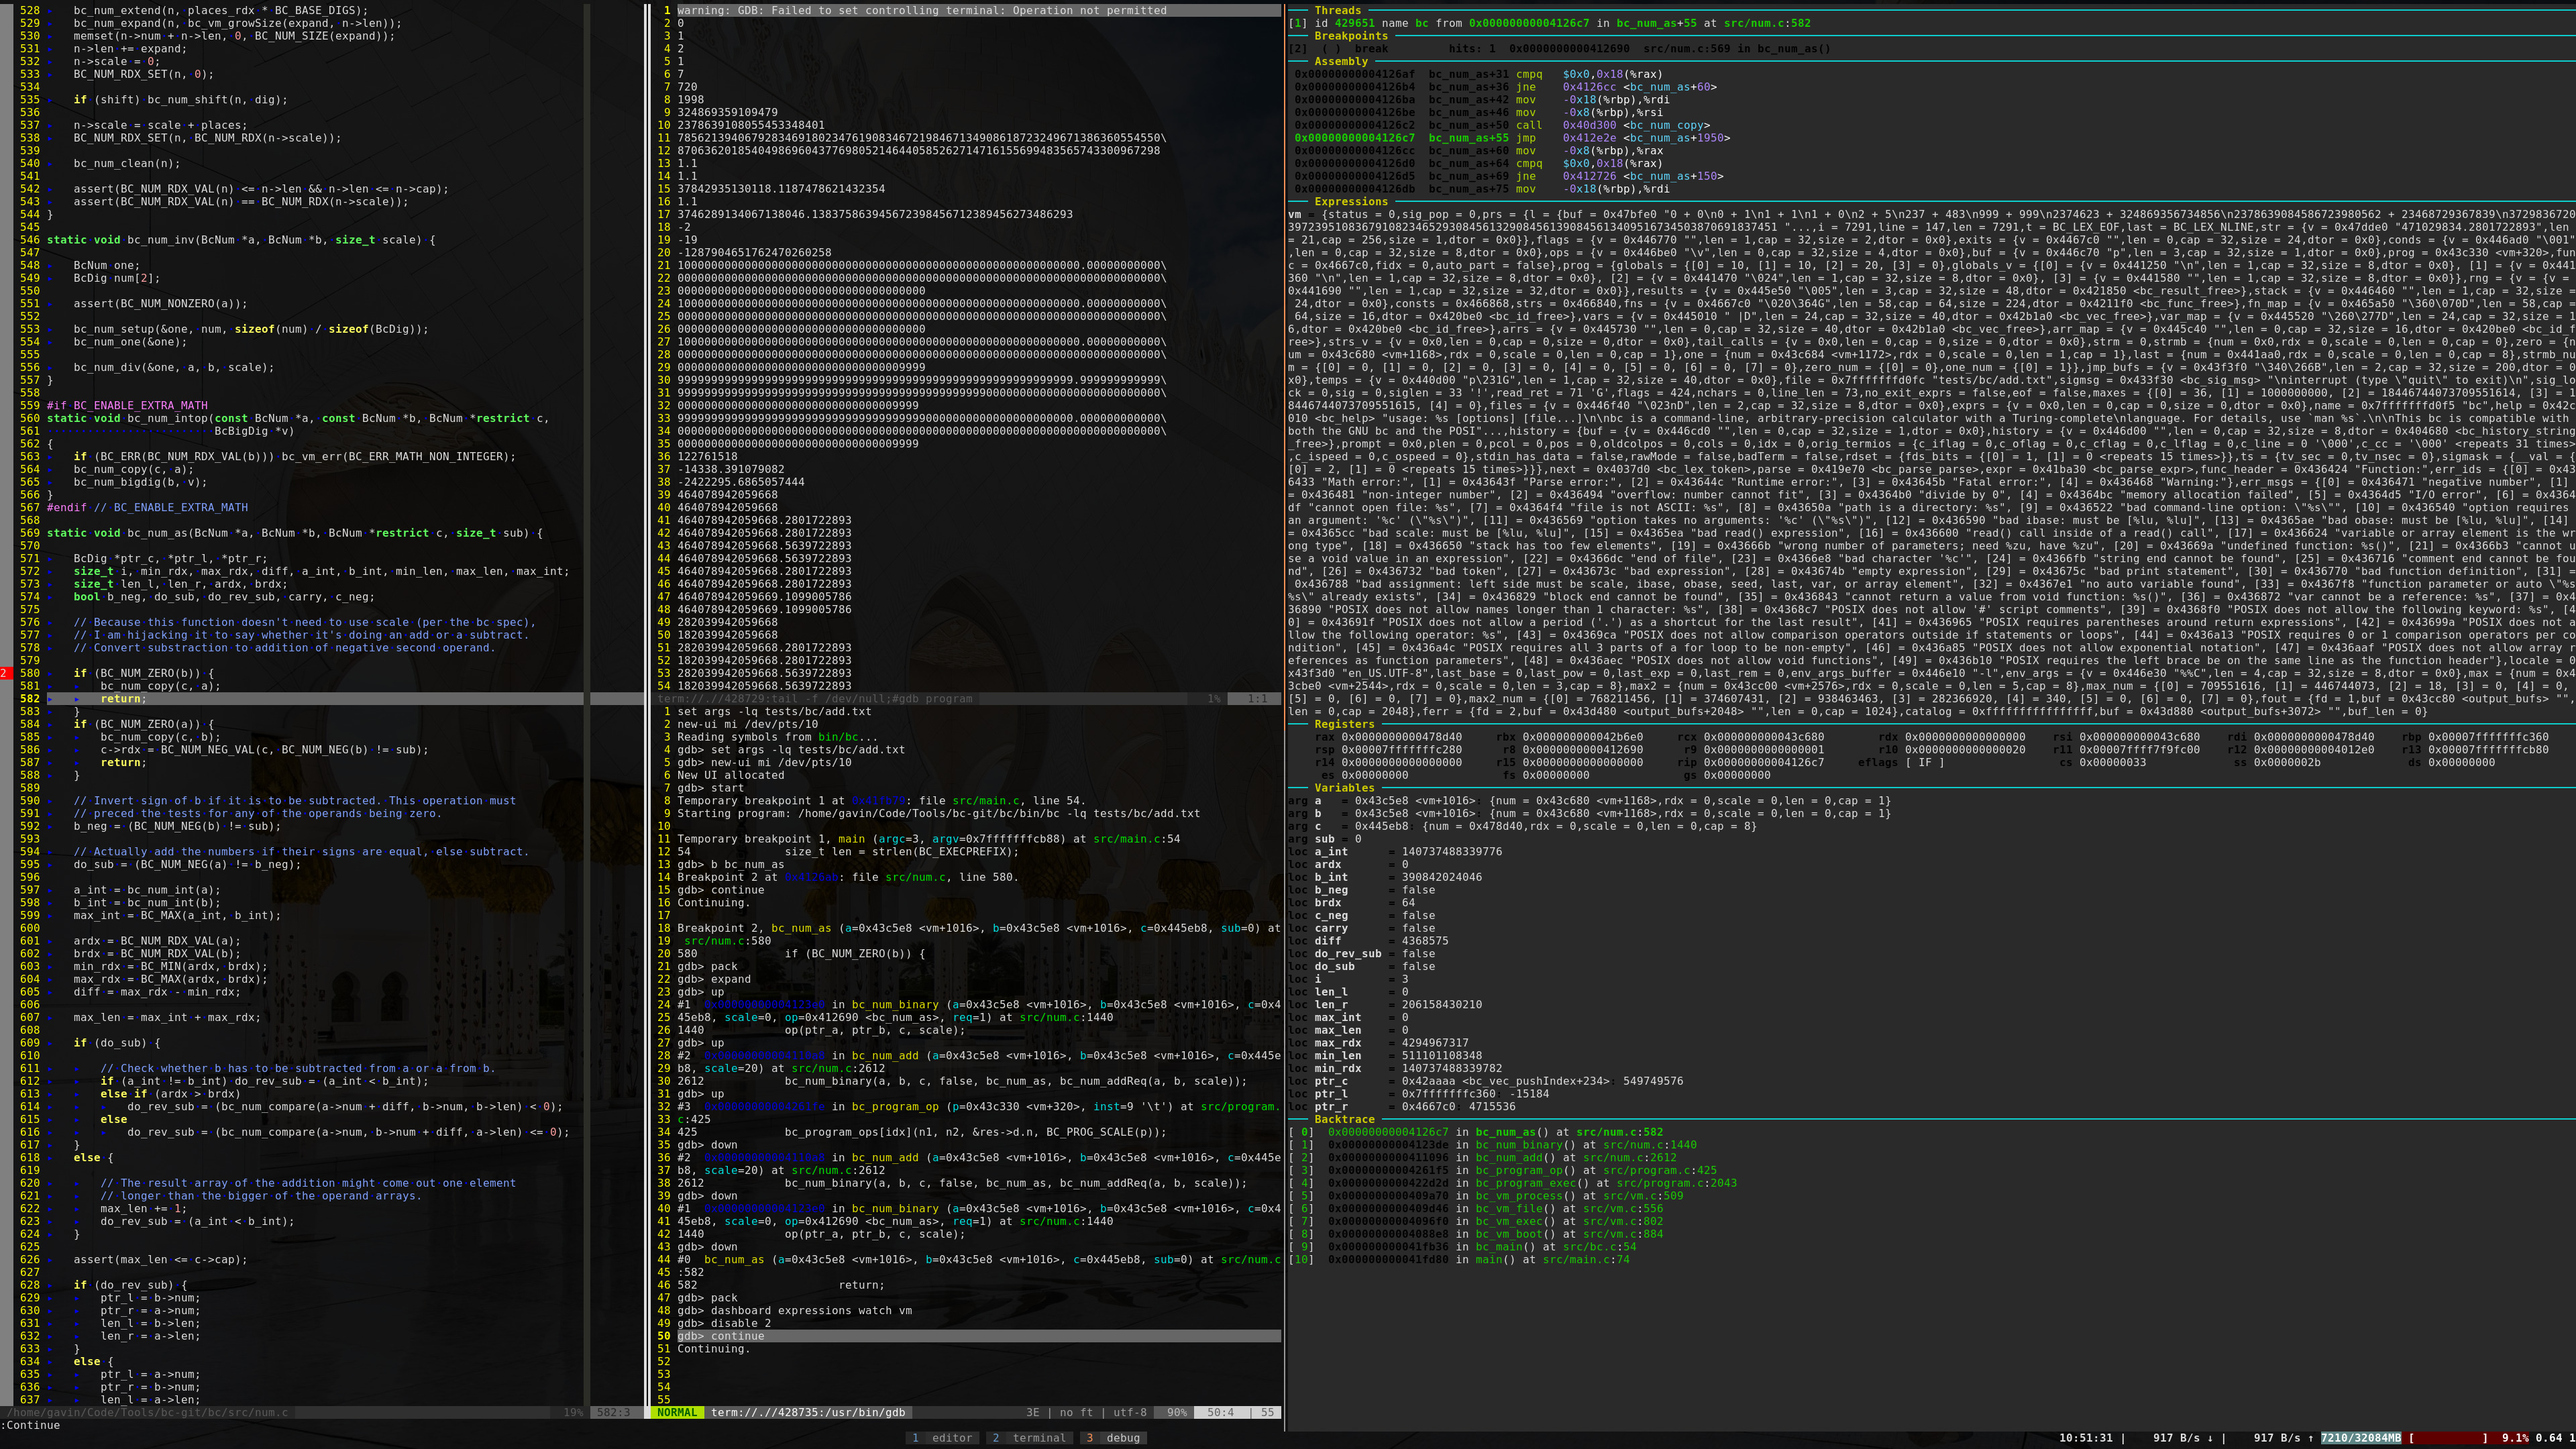
Notice that the program output is in the center left top window. If I wanted to
input something, I can press <F2>i to go to that window and enter insert mode.
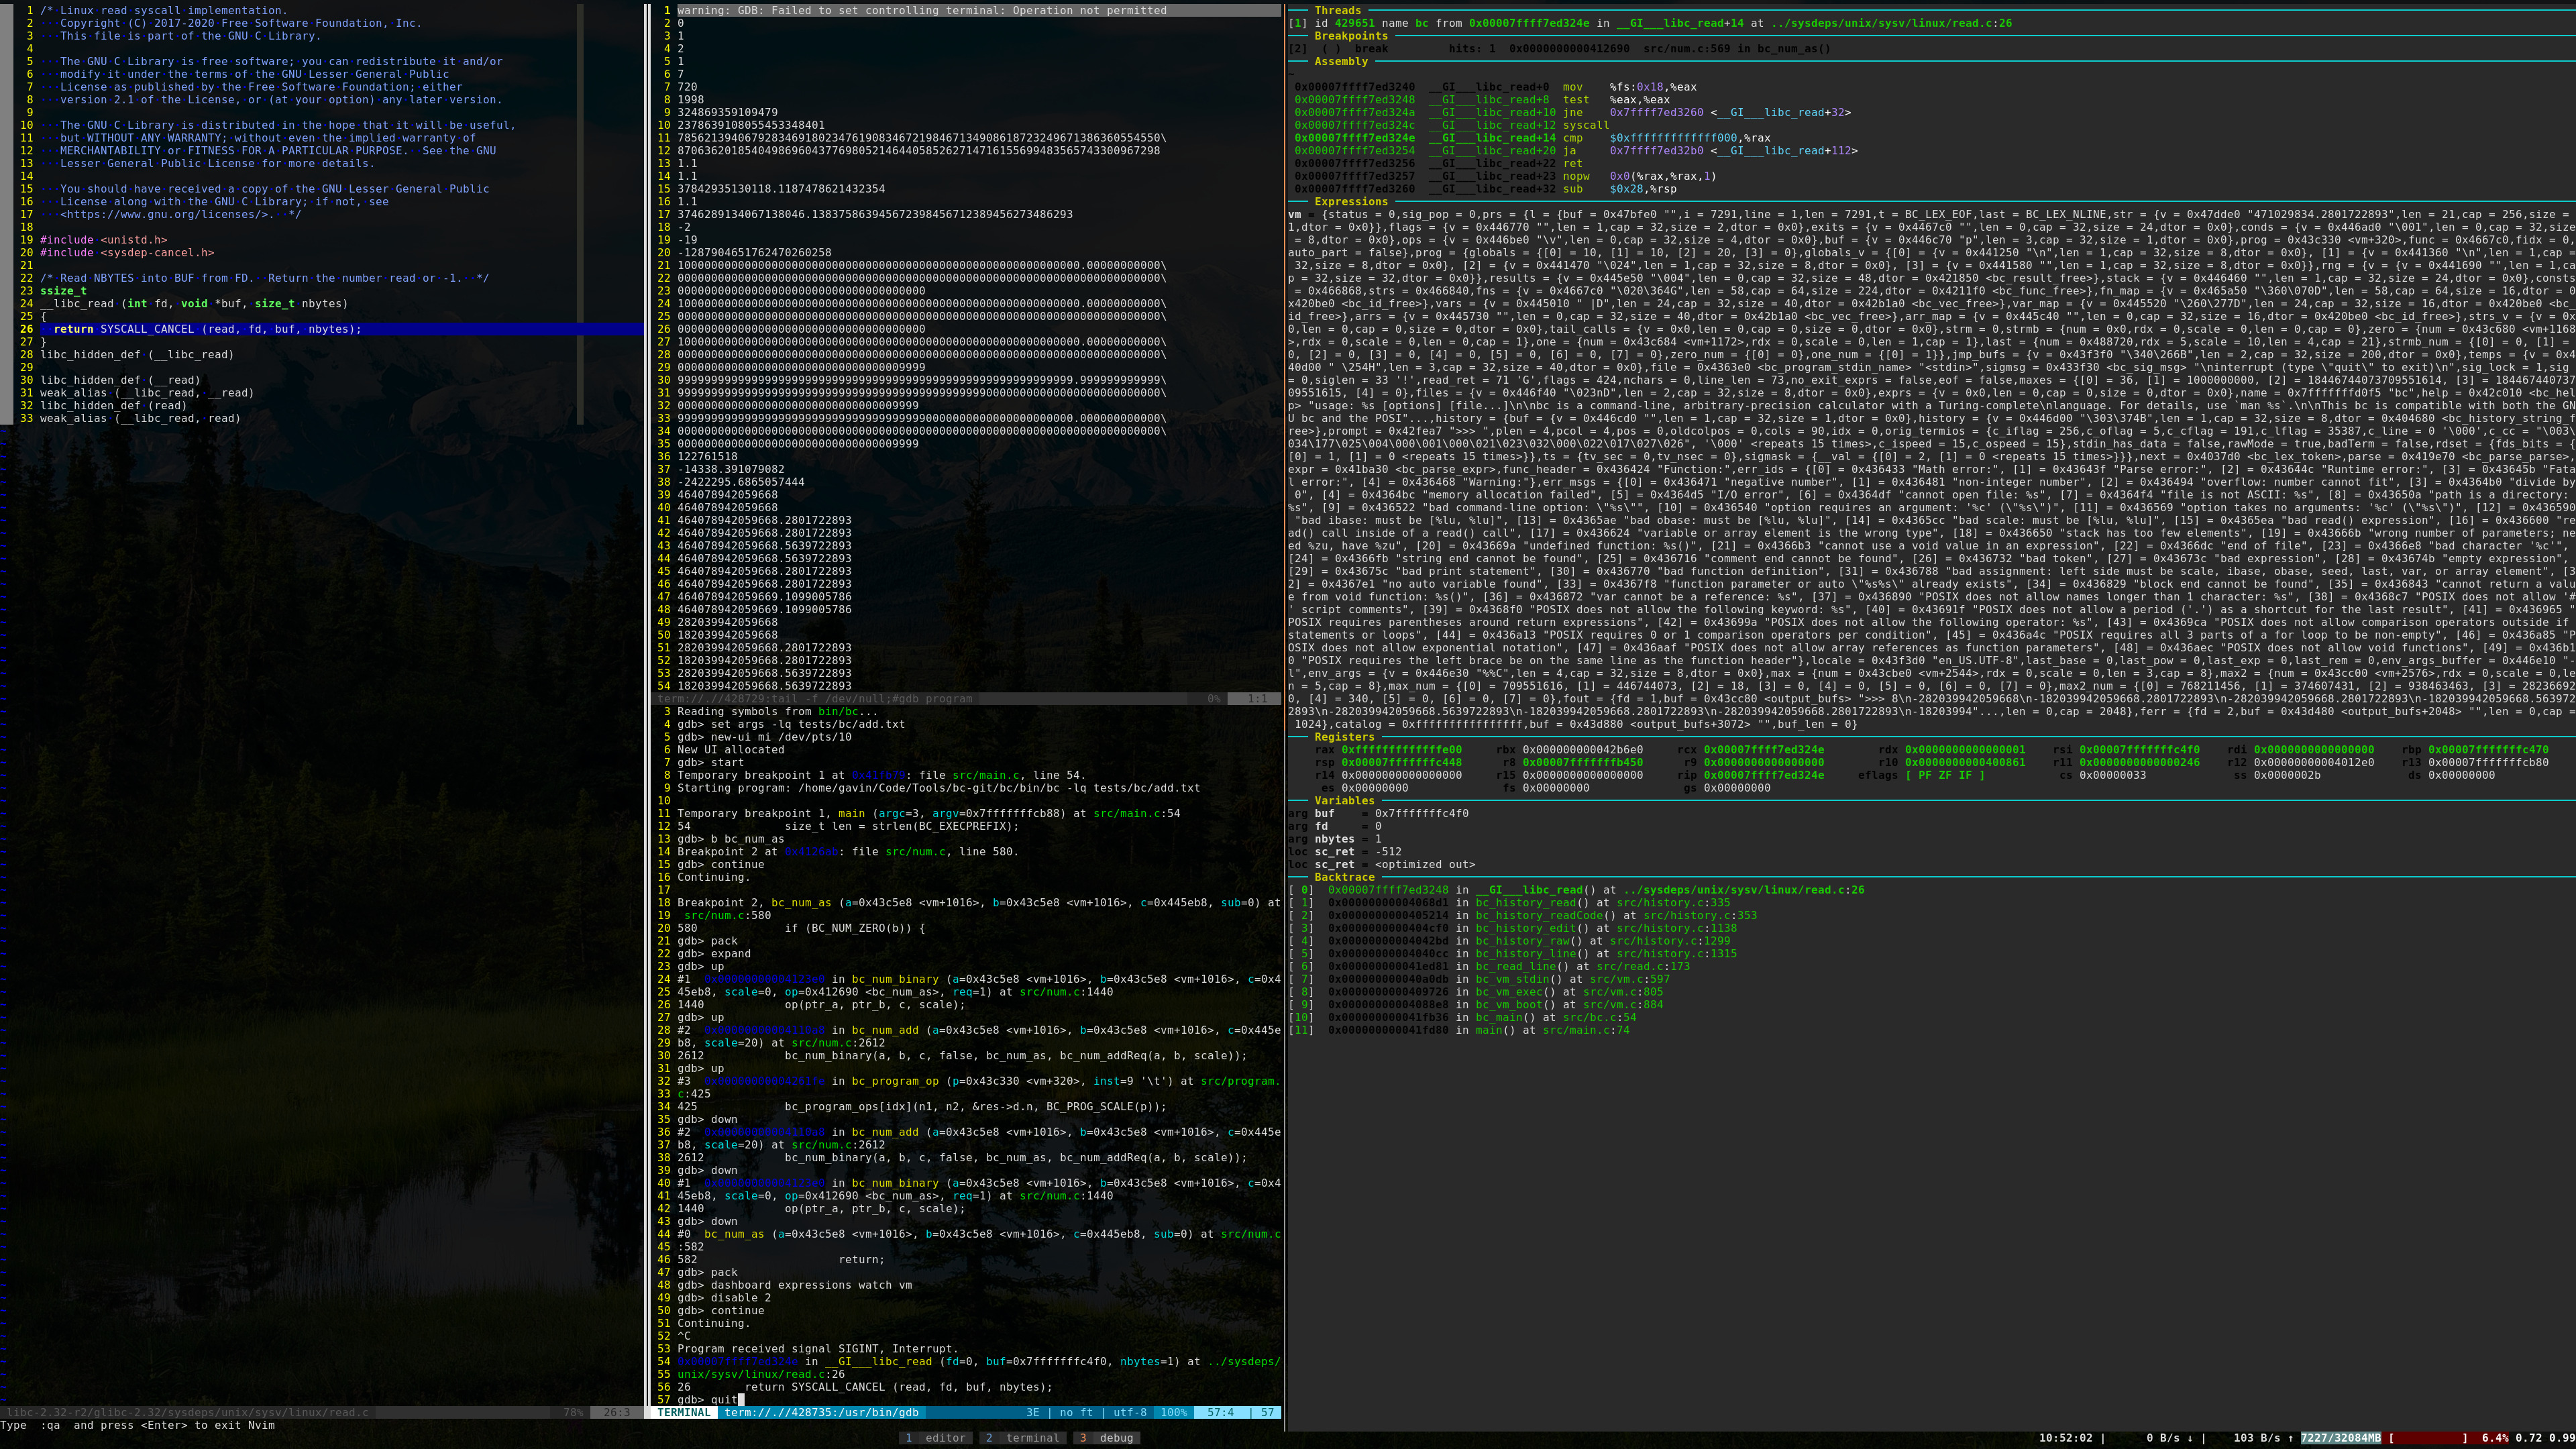
Instead, all looks good, so I enter insert mode and press <C-c> to send an
interrupt to gdb.

Then I type quit.
After I press <Enter>, Neovim closes the program window.
Then I press <C-x> (mapped to :q) to quit the gdb window, and Neovim is
reset, ready for another debugging session.
And if I wanted to exit my development environment, I go to any terminal window
and type quit.
How I Got Here
I started out as an IDE kid. I loved how easy IDE’s made it to build and debug my code.
Since I started in Java and Android, I started with Eclipse. (This was before Android Studio was a thing.) Then after struggling through university with whatever IDE was the professor’s favorite, I briefly used KDevelop before switching to Qt Creator to contribute to a Qt-based software project.
Then since I started building libraries and tools in C, I stuck with Qt Creator for a long time, about three years until about a year and a half ago.
As I grew in my skills, however, I found myself doing more and more in the
terminal and struggling against the IDE. In fact, while building bc, I would
keep Qt Creator on my main monitor and a terminal on my secondary.
It was only after I started a job (that let me go a few months back) that I was introduced to Neovim by a coworker.
It didn’t take me long to realize the potential of working in Neovim, but I really liked the debugging in Qt Creator. I decided to do some research.
In the end, after getting a PR merged into Neovim, and being introduced to
gdb-dashboard and tmux by that same coworker, I built what I shared in this
post. It took me a good week of work, but it was worth it, for myself and my
employer because I was much more productive.
Conclusion
Obviously, my setup won’t be for everyone. By their nature, development environments have to be customized for each programmer, by each programmer.
However, I hope my setup has given you a few ideas that you can use to help yourself become a better, more productive programmer.